Power Estimates of Coastal Zone Winds and Waves via Box, Whisker and Outlier Distributions at Atlantic Eastern Seaboard and Pacific Ocean Energy Sites- Juniper Publishers
Juniper Publishers- Journal of Oceanography
Abstract
The U.S. Bureau of Ocean Energy Management (BOEM) has a congressional mandate and the U.S. Department of Energy (DOE) both have mandates to assess oceanic wind and oceanic wave energy and power resources and impacts; both structural and potentially ecological. Oceanic offshore winds and waves are viewed as being relatively steady sources of energy. However assessments of the amount of the wind resources and wave resources in U.S. coastal and oceanic environments have not been evaluated and have only been estimated by several rudimentary modeling efforts. As such, there are many National Oceanic & Atmospheric Administration (NOAA) National Data Buoy Center (NDBC) Marine Buoys which have collected considerable data on both wind and waves that can be harvested and evaluated for in-situ observations. Also the U.S. Department of the Interior, Bureau of Safety and Environmental Enforcement (BSEE) is charged with the development of hazard curves for wind energy areas off the Atlantic Seaboard. As such BOEM has several proposed U. S. Eastern Seaboard, Atlantic Ocean energy/power sites. Likewise DOE is interested not only in potential Atlantic sites, but Pacific sites as well. In this manuscript we captured several representative time series of winds and waves from NOAA buoys, and evaluated those sites for their oceanic wind energy and wave energy potential, by employing a basic statistical methodology. The data sets are very self-consistent, and levels of energy vary as a function of locale, monthly, seasonally and annually. While ecological studies are called for at BOEM sites, such as on fisheries and other living marine resources, those are beyond the scope of this study.
Introduction
The U.S. federal agencies BOEM and DOE are committed, by law, to assessing oceanic wind and wave power. Wind power ensues from the flow of air through wind turbines to mechanically power generators for electricity. Wave power results from oceanic surface gravity wave (SGWs) passage through ocean based turbines to mechanically power generators for electricity. Wind and or wave power, as alternatives to burning fossil fuels, are plentiful, renewable, widely distributed, clean, and produce no greenhouse gas emissions during operation. The net effects on the environment are far less problematic than those of nonrenewable power sources. Wind farms consist of many individual wind turbines which are connected to the electric power transmission network. Offshore winds and waves are generally viewed as being steadier sources of energy than are land based sources, and far offshore farms are conceptually envisioned as having less visual impact than land based farms, but construction and maintenance costs are considerably higher than on land. Wind and wave power are believed to be very consistent from year to year but also to be characterized by significant variation over shorter time scales as SGWs are driven by winds which have great variability over “meso” hourly to daily to weekly temporal scales and spatial scales of kilometers to 10’s to 1000s of kilometers. The SCPC is one such public utility that has an expressed interest in coastal energy.
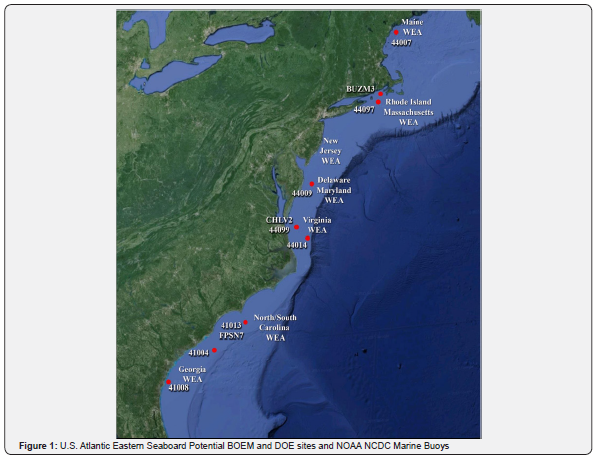
In Figure 1, we present the Wind/Wave Energy Sites (WEAs) that are of interest to BOEM and DOE. Figure 1 also shows the locations of the NDBC Marine Buoys. NOAA maintains a national coastal and oceanic based network of marine buoys described at the National Data Buoy Center (NDBC) at: http://www.ndbc.noaa., and the data are available from the NOAA National Centers for Environmental Information (NCEI) at: http://www.ncei.noaa.gov/. The data are available in a digital format and are quality assessed.
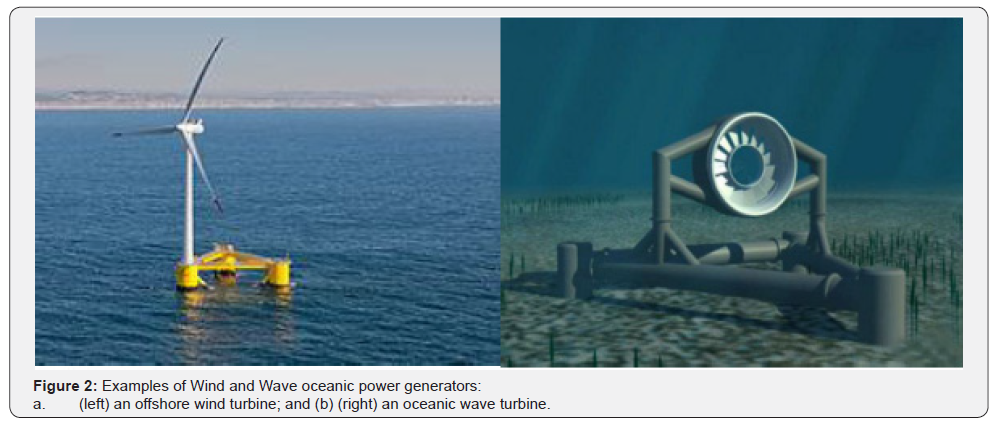
In Figure 2, examples of oceanic wind and wave energy harvesting systems are presented. As shown in Figure 2a (left panel), offshore wind turbines are subject to oceanic forcing and as such could be damaged or destroyed by exceptionally robust oceanic winds and or waves. Figure 2b (right panel) depicts an underwater configuration of a wave power system. We note that the depictions of wind and wave power generating devices shown in Figures 2a, 2b, are just two of the many that the engineering community has designed, produced and tested (for example: Falness [1], Twidell et al. [2], McCormick [3] Cruz [4]). Variability of winds and waves are well known to mariners and as such it is of value to assess the observed variability of winds and waves in the vicinities of the proposed BOEM lease sites.
Data
The NDBC Marine Buoy wind speed data are sampled every minute while he surface gravity wave data are sampled every second. On a twelve hourly basis the data are uploaded to the NOAA GOES satellite constellation and then downloaded to the National Aeronautics and Space Administration (NASA) Wallops Island Virginia receiving stations, then transferred to and checked for quality at the NOAA NCEI in Asheville NC, and subsequently archived into the NCEI archives. Other atmospheric and oceanic state variable data are also collected but are not dealt with in this report.
Statistical analyses of weather and climate state variables have often focused on averages of the atmospheric and oceanic variables, such as record length mean wind speeds or mean wave amplitudes or some kind of continuous or box-car or rolling averaging of the various time series [5]. However, the means and departures from the mean are also of interest in the realm of renewable energy. In addition to a determination of the wind and wave potentials for producing sources of renewable energy [6], as mentioned above, there are also agency and industry concerns about deploying expensive structures in and on the ocean in areas where there could be naturally occurring excessively high winds and or very large amplitude waves that could destroy those structures [7]. As such, the totality of the various time series contain the complete signals of wind speeds and wave amplitudes, but in actual fact, the time series look very noisy in raw time series format and various methods have been used by investigators to separate the “signals” from the “noise” [8].
In attempting to separate signal from noise, this study consists of a statistical decomposition of the distribution of atmospheric winds and oceanic surface gravity waves collected by NOAA NDBC Marine Buoys, in the vicinity of the BOEM sites in the Middle and South Atlantic Bights (MAB and SAB, respectively). The NDBC sites were selected by their locations near BOEM and DOE potential sites. The study considers wind speeds and wave amplitudes in a descriptive statistical manner using what are called box plots. A box and whisker plot is a convenient way of graphically depicting groups of numerical data through their central 50% distributions, their medians (their “boxes”) and nominally their upper and lower quartiles (their “whiskers”). Our box plots also have crosses extending vertically from the upper quartile whiskers, which we take to be about 23.5% of the uppermost observations, indicating 1.5% variability above the upper 98.5% of the observations of a particular time series record. Thus we invoke the term of box-andwhisker- and–outlier (B&W&O) plot.
Outliers in the upper several percent of the upper quartiles are plotted as individual points and signify individual observations of relative extreme magnitudes. Box plots are non-parametric in that they display variation in samples of a statistical population without making any assumptions of the underlying statistical distribution. We present our decomposition plots as a function of month by year and wind speeds and wave amplitudes as a function of year by month. The variability of winds and waves from site to site, over the years at a specific site, and by month at a specific site can be considerable. We also have duplicate plots of the outliers, in which we have connected the outliers to provide a better visual sense of the extreme observations. The data can be used to validate numerical model output by individual atmospheric event, by clusters and or families of atmospheric and or oceanic events.
Methodology
The methodology used to decompose the NDBC Marine Buoy data sets is commonly referred to as Box and Whiskers or “B&W” (Bendat and Piersol, 2000) decomposition. The B&Ws basically and to lowest order decompose the data into the percent (%) of the total distributions recorded at the sites in terms of their 50% overall central amplitudes, about which there are upper (25%) and lower quartiles (25%) centered about the medians. The medians are contained within the 50% “boxes”. Then there are the upper and lower amplitude quartile “whiskers”. Within an as an extension of the whiskers, there are extreme event signatures or “outliers”; both below and above the lower and upper whisker quartiles. Again, these represent extremely low and extremely high amplitude events.
Here is what is done mathematically to compute the Boxes and Whiskers (and “Outliers”); (B&W&Os):
(1) Calculate the height of the box (Y coordinate of top - Y coordinate of bottom). This is called the «interquartile range» as it is the distance between the 75th and 25th percentile (first and third quartiles);
(2) Above and below the box, draw whiskers of length 1.5 times that interquartile range; and
(3) Plot any points beyond the whiskers as potential outliers or extremely high amplitude events, relative to the particular distribution of observations at a specific site.
In the plots to follow, there are many potential outliers above, but not below the whiskers. That would suggest, for example, if one were modeling wave height versus wind speed or some other variable, we would put wave height on a logarithmic scale to make it look more symmetric and normal. It could well be that if we did the B&W on a log (wave height) scale; we would have many fewer “outliers”. As these “O’s” represent valid data, there is no need to make the data distribution appear to look normal. As was pointed out by Gladwell [9], an “outlier” is a statistical observation that is markedly different from the others of the sample. Thus, the B&W&O methodology does an excellent job in distinguishing those singular data points
If we have a distribution, one that is normal for example, we can calculate the theoretical endpoints of the whiskers. There will remain some probability of being beyond those endpoints; maybe it might be only 0.001. Now if we were to have, say, 1 million points you would expect to have (0.001) X (1,000,000) = 1000 points beyond those whiskers, that is, there is no adjustment for sample size. Even in a perfect theoretical distribution, given enough points, some will fall outside those whiskers. So we now look at the distributions of the wind and wave amplitudes and describe the distributions derived from the NDBC Marine Buoys.
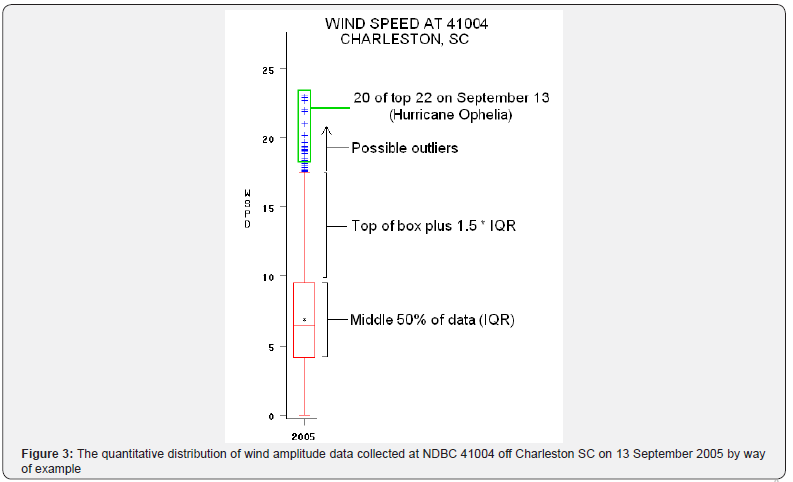
We will first present an example of a B&Ws plot for one day from NDBC buoy 41004 offshore of Charleston South Carolina (SC). That day Figure 3 is 13 September 2005 during the passage of Hurricane Ophelia. 50% of the winds recorded on that day were between 4 and 9.5 meters/second (m/s) with a median of 7m/s. The lower quartile is between 0 and 4m/s. The upper quartile is 9.5 and 17.5m/s. As it occurs, in 2005, 20 of the top 22 observations between 18 and 23.5m/s that would be considered outliers occurred during the passage of Ophelia. The other two were likely wind gusts which occurred prior to the formal arrival of the hurricane, and on the same date.

In Figure 4 we see the wind amplitudes at the same site from 1978-2005. Clearly, hurricanes have contributed a significant share of the most extreme outliers recorded at site 41004, off of Charleston SC, over the 18 year period. However there are many other dates when significantly high winds were recorded; even in excess of 30m/s. SC is at the southernmost extent of the zone of the genesis of Extra - Tropical Cyclones (ETCs), a zone centered about Cape Hatteras North Carolina (NC). We will look at this more in depth as we consider wind amplitudes by moth later in the text. The Years 1978, 1981 and 1986 had relatively few extreme events. We note that there are many years without complete time series; a hazard of marine buoys that, being subjected to harsh oceanic conditions, often break down and are left non-serviced for lengthy periods of time; as NOAA must schedule vessels to assess damage and provide service of either repair or replacement.
In Figure 5, we see the wind speed distributions (in percentage (%) of total) shown in Figure 4 as a function of frequency (in wind speed/day). As we can see, the complete suite of observations of wind amplitudes over a total period of 18 years, assume the distribution of a log normal function. The lower quartile, 50% middle, the upper quartile and the outliers, shown as blue crosses and flags, are also shown.

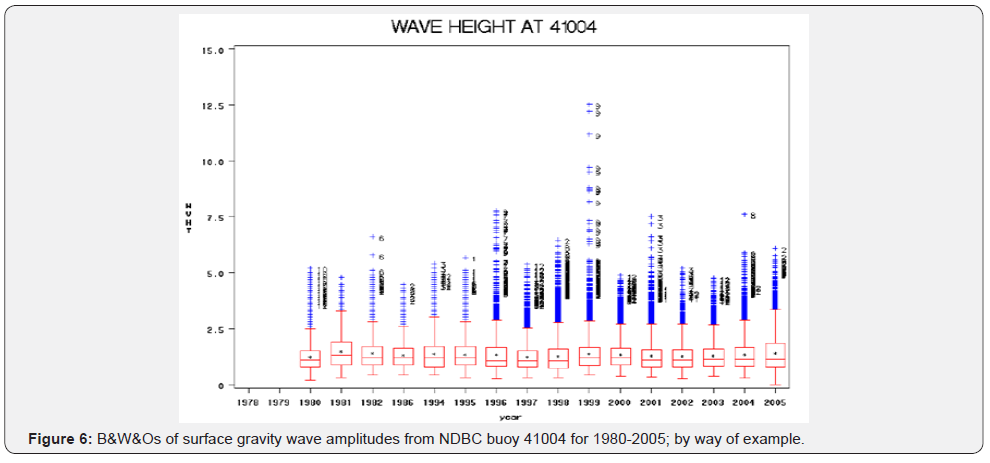
In Figure 6 we present the surface gravity wave amplitude observations from NDBC buoy 41004. Wave heights are presented in units of meters and the numbers on the blue crossed outliers indicate the specific months during which those relatively high amplitude waves were measured. Years 1999, 1996 and 2001 were especially high energy years with most extreme events in 1996 having occurred in September, thus related to hurricane passages while during the month of March in 2001 due to Mid-Latitude cyclone passages.
Figure 7 displays the wave amplitude distributions (in % of total) shown in Figure 6 as a function of frequency (in wave heights in units of meters/day). As we can see, the complete suite of observations of wave amplitudes over a total period of 16 years, assume the distribution of an exponential function. The lower quartile, 50% middle, the upper quartile and the outliers, shown as blue crosses and flags, are also shown.

The annual distributions of wind speeds and the wave amplitude distributions are in solid agreement. However it is clear that wave amplitudes are not only a reflection of the local generation of waves (“sea”) but also carry the arrival of waves which have been generated elsewhere (“swell”) and which have propagated into the area of the buoy and thus contribute to the overall wave amplitude measurements. Curiously the spectral distributions of the wind speeds Figure 5 and that of the wave amplitudes Figure 7 appear to be “log normal” in the winds versus “exponential” in the waves. The reasons for this are not presently known and this could be a universal finding. The peer reviewed literature contains no reference to these results and thus original findings. It is herein speculated that momentum inputs from atmospheric winds are non-linearly transferred into wave momenta.
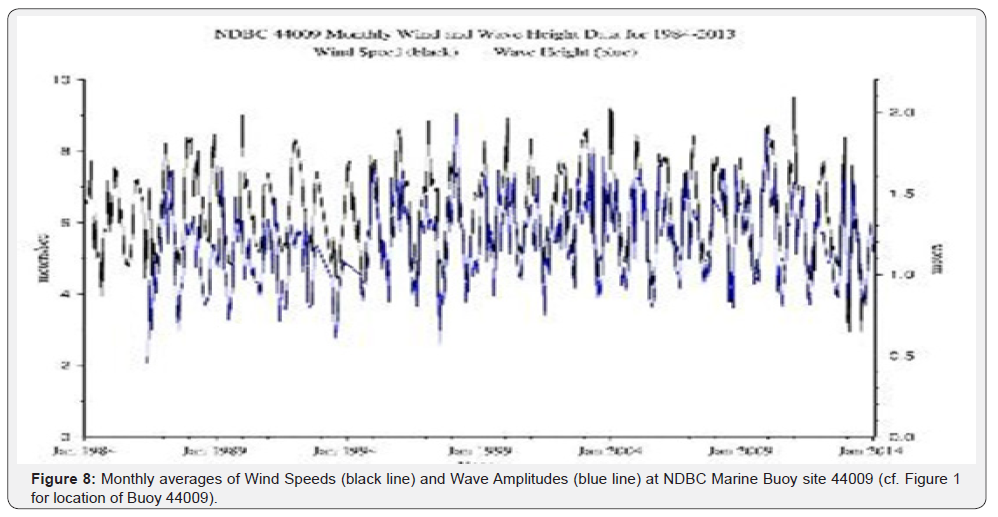
We now look at the archived records of wind speed and wave amplitude data collected on NDBC buoys in the areas of interest to BOEM and DOE and shown in Figure 1. For example, in Figure 8 we consider the time series, data length plots of monthly wind speeds and wave amplitudes at Station 44009, by way of example close to a potential BOEM and DOE site off Chesapeake Bay, Virginia.
In Figure 8 we see that there were many periods of missing data, as is not uncommon with Marine Buoy data; particularly wave data. For NCDC 44009, the missing wind data months are Jan 1985, Jan-Feb 1986, Dec 1988, Feb 1989, Jul 1990, Jan - Apr 1991, Dec 1992 - Apr 1993, Oct 1995, Nov 2004, Dec 2008 - May 2009, Mar - May 2010, Sep - Dec 2013. All other months are complete. At NCDC 44009 the missing data months for waves are Dec 1988, Nov 1992 - Apr 1993, Jan - May 1994, Oct 1995, and Jan 2013. All other months are complete. The missing months were linearly interpolated with straight lines; which leave one with the impression of coherency. This latter exercise was straightforward but not without mathematical challenges; if it were to be done properly. However that is beyond the scope of this report, which is informational in nature and content. In general and for the most part, the wind speed and wave amplitude data track closely, with the appreciation that while the wind field is “local”, the wave amplitude field consists of near-field locally generated waves or “sea” and farfield or “swell” which propagates into the measurement domain. As shown (in a representative example), the monthly mean winds range from 4 - 10m/sec and monthly mean wave amplitudes range between 0.5 - 2m, both with highs in January – March and lows from June - August. Overall, the monthly averaged wind speeds and wave amplitudes at all of the NDBC stations shown in Figure 7, are highly visually positively correlated in keeping with the Figure 8 so are not shown here.
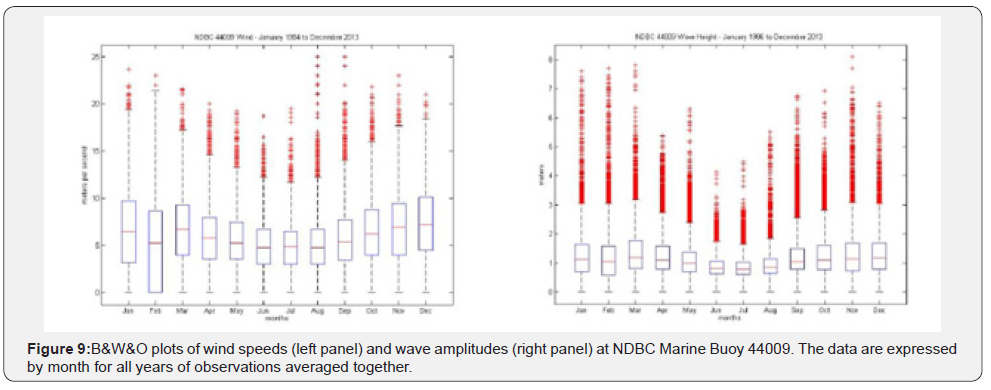
We next consider the B&Ws by month for all years averaged together for wind speeds, location, versus their wave amplitude counterparts for NDBC Marine Buoy 44009, are presented by way of example in Figure 9.
In Figure 9, the medians and 50% “boxes” of both wind speeds and wave amplitudes reach annual minima from June – August and both peak over the period of November – March. This is not so evident in the more conventional time series plot shown in Figure 8. In Figure 9, upper quartile (dotted line “whiskers”) and outliers (red crosses) are highest in August and September, reaching 30m/s, associated with the infrequent but highly energetic passages of hurricanes (we note that in the Figure 5 representation of years by month, the month of September is most prominent), followed by November and January – March, reaching 25m/s, associated with the frequent passages of ETCs. Wave amplitudes are in-kind, reaching 7.5 – 9m in winter and only 7m in September, unlike the 41004 counterpart which reached 13.5m in September (Figure 5). This description is not in the least evident in Figure 8. Thus we conclude that there is substantial informational content of a different kind in the representations of B&W&O winds and waves presented in Figure 9.
In a complete sweep we decomposed the time series of wind speeds and wave amplitude observations at the NOAA NCDC Marine Buoy Sites near the BOEM and DOE sites, as shown in Figure 1, into B&W&Os by individual month as a function of years and by individual year as a function of months. The year to year variability, month to month and site to site variability in distributions was considerable and will be summarized next. Unfortunately several of the sites lacked wave data and several of the sites had time series that were abbreviated in length. To provide the most comprehensive overview, we present the winds and waves at the northernmost site, 44007, a central site, 44009, and the southernmost site 41008; as these three stations had the more complete time series. These are presented in Figure 10, by months averaged over the years of the composite time series records. The outlier data, which appear as the red crosses above the “whiskers” in Figure 10, are captured within upper and lower solid lines for better visualization moving from month to month and between buoy sites as a function of buoy location. The topmost left and right upper panels are data from Maine (ME), the middle left and right panels are from Delaware/ Maryland (DE/MD) and the lower panels are from Georgia (GA).

In Figure 10, we see that in general, 50% of the wave amplitude data are between 0.5 and 1.5m at all sites for all months, with annual lows in June – August and annual highs between September – January. The same 50% annual distributions are true for wind amplitudes between 0 and 10m/s at the ME and DE/MD sites and between 0.25 and 8.0m/s at the GA site.
We next look at how wind speed changes as a function of locale relative to a being onshore of the coast, at the coast, where the land meets the sea, versus offshore along the U.S. eastern seaboard; on a perpendicular transect. Unfortunately, there are very few studies which have been done of such an assessment due to a lack of data. In Weisburg and Pietrafesa (1982; 1983) and Pietrafesa and Weisburg (1983) it was shown that coastal wind speeds along the Southeastern seaboard from North Florida to Virginia, increase by 1.5 to 2.5 times from 10 kilometers onshore to 20 kilometers offshore (from land based wind sensors at coastal airports and NOAA marine buoys . At the time this was an astounding revelation. The cubic nature of wind speed increases that Weisburg and Pietrafesa revealed means that winds 1.5 to 6km offshore will be 3.4 to 16.3 times their coastal counterpart values; with likely commensurate but yet still unknown increases with height. Pietrafesa & Weisburg [10] attributed these findings to the fact that over land the winds had to deal with land and vegetation as a drag, essentially a no-slip condition, on the low level winds because of an inter-actively coupled land-atmosphere boundary layer (BL) that was onshore-offshore, the lateral (LBL) and ground level to atmospheric level, the vertical (VBL) in nature. Winds blowing over coastal waters can slip but are still constrained at the air-sea interface. As you move offshore, away from the LBL the drag becomes less and the winds increase both offshore and upward. However the location of the 1.5 to 2.5 times increase was ill determined. These results are shown in Figure 11.

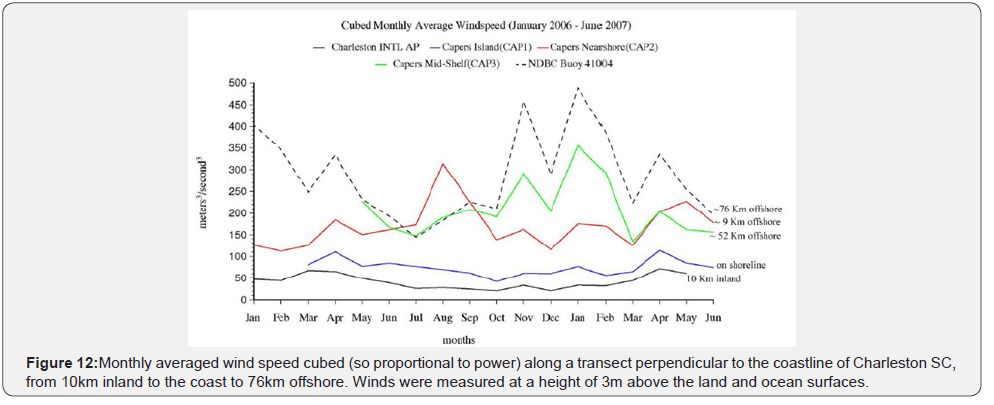
In 2009-1010, a SCPC – DOE study of winds and waves at 1.5 to 3.0 to 6.0 to 12.0km moored array off on the SC coast [11] advanced the understanding of the rapid increase in wind speeds from land to 3-6 km offshore. There were no wind measurements made above 3m above the water surface. In Figure 12, we show an 18 monthlong time series of wind speed energy, i.e., wind speed cubed, wind power, along the transect from 10km onshore to 76km offshore of SC. Clearly the wind power available over land and at the coast pale by comparison to those over the coastal ocean of SC.
Most U.S. manufacturers rate their turbines by the amount of power they can safely produce at a particular wind speed, usually chosen between 24mph or 10.5m/s and 36mph or 16m/s. The following formula illustrates factors that are important to the performance of a wind turbine. Notice that the wind speed, V, has an exponent of 3, which is a cube, applied to it. This means that even a small increase in wind speed results in a large increase in power. Read How high should your small wind turbine be for more information. That is why a taller locale will increase the productivity of any wind turbine by giving it access to higher wind speeds at height. The formula for calculating the power from a wind turbine is: P (winds) = P (W) = k (ρA/2) Cp AV3 where, P = Power output, kilowatts, Cp = Maximum power coefficient, ranging from 0.25 to 0.45, dimensionless (theoretical maximum = 0.59), ρA = Air density, lb/ft3, A = Rotor swept area, ft2 or πD/2 (D is the rotor diameter in ft, π = 3.1416), V = Wind speed, mph, k = 0.000133, a constant to yield power in kilowatts. (Multiplying the above kilowatt answer by 1.340 converts it to horse-power (i.e., 1 kW = 1.340 horsepower)). The rotor swept area, A, is important because the rotor is the part of the turbine that captures the wind energy. So, the larger the rotor, the more energy it can capture. The air density, ρ, changes slightly with air temperature and with elevation. The ratings for wind turbines are based on standard conditions of 59 °F (15 °C) at sea level. The conversion to metric units is: Pwind = 0.2611 V3 kilowatts for a 200m rotor; centered about 100m at the axis. From the plot below, P at 9km offshore would yield a range of 40 to 65 kilowatts centered about an average of 45 - 50 kilowatts of power. However these values shown in Figure 12 are derived at a 3m height above land and sea surfaces. There is scaling with height, so real values are likely much higher but we do not know what that scaling is in nature. Wave power can be estimated as Pwave = H2T/2, where h is the wave height and T is the wave period.
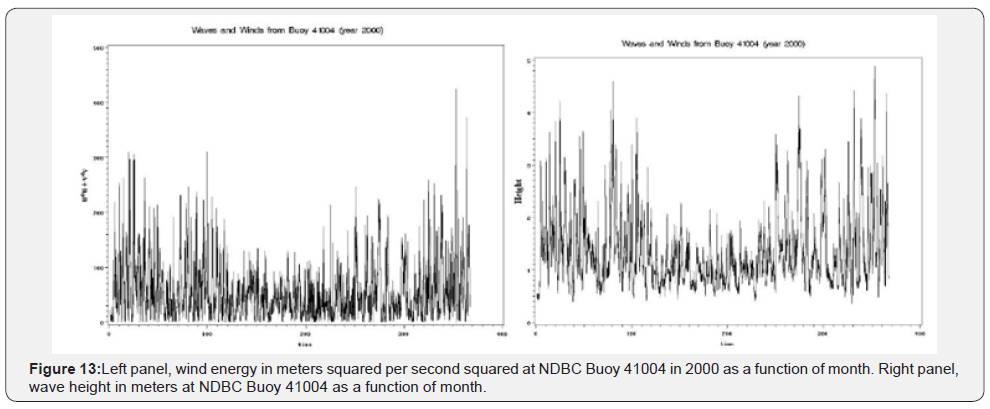

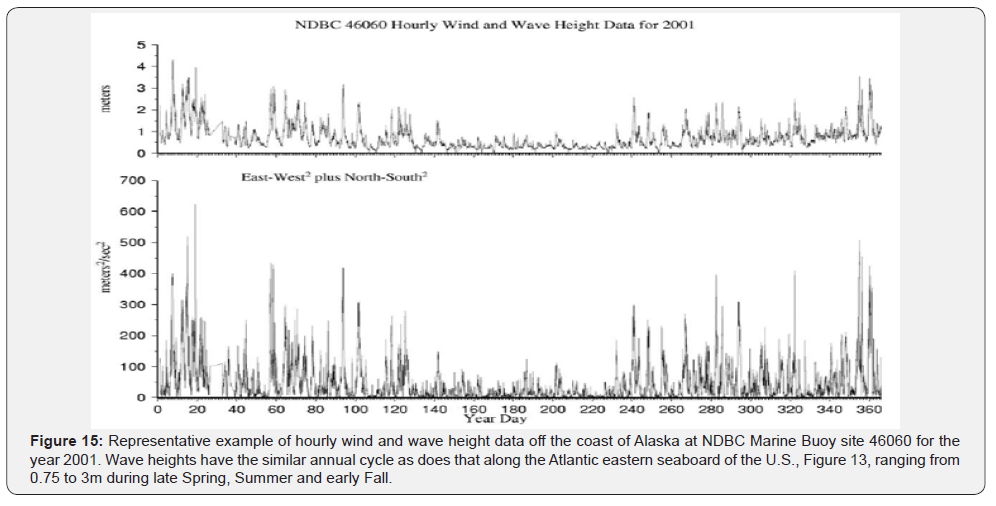
In Figure 13 we see the annual wind energy and wave field height offshore of Charleston SC for the year 2000; in which there is continuous data. Obviously the winter and fall months are the most energetic. Clearly the wind energy and wave height appear to be quite robust off of Charleston SC. But how does the wave energy field compare to those along the North Carolina (NC)/Virginia (VA) and Oregon (OR) coasts. Figure 14 shows that comparison. Clearly OR waves are far more energetic than are the SC, NC and VA coasts. The OR coast waves are 3 times more energetic then those at SC and NC/VA. The wind and wave energy profiles as a function of month, while different in magnitude, appear to be non-denominational by region, on an annualized cycle; relatively low in late spring through summer and into fall, and then relatively high in late fall peaking in winter and dropping off into early spring. We have compared SC to NC to VA and OR. How about Alaska (AK)? We turn to Figures 15 & 16 for AK.
Wave power can be computed as: P (Ocean Waves) = P (OW) = ρWg2 H2T/64π, where ρW is ocean water density, g is gravitational acceleration, H is the significant wave height, and T is the wave period. P (OW) can be estimated as P (OW) ~ H2T/2 in kW/m/s (i.e., per meter per second of wave crest or front). Thus the wave field at NDBC Buoy 41004 (Figure 13) is nominally ~ 18 - 36kW of potential power during the late fall, winter and early spring for 3m, 8 second waves and ~ 5 - 6kW of potential power over the summer for 1.5m, 5 second waves. This is case at NDBC Buoy 44014 off of Virginia as well. Alternatively in Figure 14, we see that the wave field off Oregon is shown to possess three times the wave power potential of the Carolinas and Virginia so could be up to ~ 50 to 75kW for 12 meter squared, 10 second waves. Alaska wave field power potential (Figures 15 & 16) is shown to be similar to that of the Carolinas and Virginia, save for the year winters of 2003 and 2004 during which a doubling of wave power potential was observed (Figure 16 right panel).

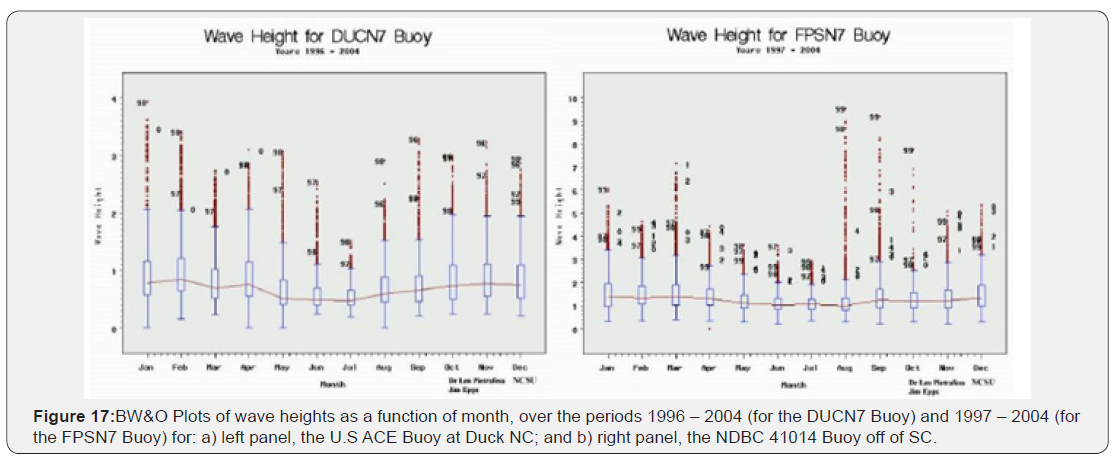
It is of note that during atmospheric storm periods, the largest waves offshore can be significantly higher than normal, are up to 13 meters high (Figure 5) and have a period of about 15 seconds. According to the above formula, such waves are capable of carrying up to 1.5MW of power across each meter of wave-front. Such storm period data are presented in Figures 5 & 17 a, b, for the coastal locations of NDBC 41004 off SC, the U.S. Army Corps of Engineers facility at Duck NC (Figure 17a) and at the NDBC Marine Buoy at Frying Pan Shoals NC (Figure 17b), respectively. Individual storms are frequent and generate waves with huge power potential.
Figure 15 Representative example of hourly wind and wave height data off the coast of Alaska at NDBC Marine Buoy site 46060 for the year 2001. Wave heights have the similar annual cycle as does that along the Atlantic eastern seaboard of the U.S., Figure 13, ranging from 0.75 to 3m during late Spring, Summer and early Fall.
In Figure 16 we see the AK annualized averaged monthly wind energy and wave amplitude data for the years 2000 – 2003 in the left and center panels, respectively, and the wave height energy over the years 1999- 2004, right panel. Curiously there were 3-fold explosions of wave energies over the winter months of 2003 and 2004, depicted in the right panel. The wind energies and wave heights were consistent over the years 2000- 2003 as shown in the left and middle panels.
Conclusion
The U.S. federal agencies of BOEM and DOE have a congressional mandates to assess oceanic wind and oceanic wave energy and power resources. Offshore winds and waves are viewed as being relatively steady sources of energy. However assessments of the amount of the wind resources and wave resources in U.S. coastal and oceanic environments have not been evaluated and have only been estimated by several rudimentary modeling efforts. In this manuscript we show that the many NOAA NDBC Marine Buoys, and an ACE Buoy, have collected considerable data on both wind and waves that we have harvested and evaluated for insitu observations. U.S. power companies, in keeping with power companies from around the planet, have expressed interests in developing renewable wind and wave energy farms. Likewise, ecological studies involving impacts on fisheries and other living marine resources [12,13] are also called for in BOEM’s mandate, those potential impacts are beyond the scope of this study.
We have employed several statistical techniques to reveal the richness of both wind and wave power potential at the proposed BOEM sites and sites of potential interest to DOE. We extended our eastern Atlantic seaboard study to Oregon and Alaska as well for comparative purposes. The data sets are very self-consistent, and levels of energy vary as a function of locale, monthly, seasonally and annually. U.S. coastal environments are shown to contain enormous wind and wave power potential. The statistical methodology of Box – Whisker - Outliers was shown to be a very powerful technique in assessing monthly to seasonal to annual to inter-annual variability of winds and waves, as well as to demonstrate the individual high energy events, specifically by environmental storm source.
For more about Juniper Publishers please click on: https://twitter.com/Juniper_publish
For more about Oceanography & Fisheries please click on: https://juniperpublishers.com/ofoaj/index.php

Comments
Post a Comment