A Comparison of Fish Kills in the Pamlico River and the Neuse River in Coastal North Carolina (A Symptom) and Abiotic Factors (The Root Causes)- Juniper Publishers
Juniper Publishers- Journal of Oceanography
Abstract
For many decades the State of North Carolina (NC) witnessed fish kills in its coastal waters, particularly its inshore coastal estuarine and riverine waters. This study looks at fish kill data collected from two adjacent coastal rivers, the Neuse River and the Pamlico River, which both experienced fish kills over an 11 year period, and looks at possible naturally occurring abiotic environmental factors which may have contributed to or been responsible for the documented numbers of fish kill events and the sizes of those individual and collective events. In our study, naturally occurring abiotic environmental factors, including excessive precipitation or the lack thereof, and seasonal atmospheric wind fields, and subsequent estuarine circulations, were found to be responsible for creating strongly vertically salt stratified conditions in both river- estuaries, lowering dissolved oxygen levels in the bottom layers in the two separate rivers. We also present the possibility that excessive nutrient loading of both rivers may be responsible for lowering oxygen levels. These factors may have resulted in the fish kills.
Introduction
Fill kills are events which occur occasionally in NC coastal waters. The question is: why do these kills occur? In the early 1990's the occurrences received more public attention and political scrutiny because of the increased exposure of NC's dependence upon the use and health of coastal and estuarine waters for their livelihood, e.g. fishing, agriculture, and ecotourism, etc. and of visitors who come to the state for business and pleasure. During that period of time there was individual biological scientist who made the claim that the fish kills specific to the Neuse River were related to a previously unrecognized fish flesh eating organism, Pfiesteria piscicida is a dinoflagellate species of the genus Pfiesteria that some researchers claim is responsible for many harmful algal blooms in the 1980s and 1990s on the coasts of NC and Maryland [1]. Piscicida means «fish-killer» and was found in Neuse River waters. However, that claim was subsequently challenged by other scientists claiming that the findings were flawed [2] and other environmental factors likely contributed to the fish kills; with the vampire organism attacking the dead fish after the fact. That scenario would be analogous to the role of Turkey Vultures on land. This dinoflagellate may have been a carnivore but was not a killer. Proof of what actually occurred in the Neuse River was never scientifically documented; specifically that the purported flesh eating organism was responsible for the reported fish kills. Moreover the Pamlico River, which is adjacent to and north of the Neuse River was never part of the public and or scientific community fish kill discussion at the time, and may have never been biologically sampled. We do not know if it was or was not. What we have been able to accomplish is to acquire the files of fish kills over an 11 year period of time from both the Neuse and Pamlico Rivers, via a NC state agency, and to compare the numbers of events, the size of the events and possible causes of the fish kill events.
We revisit and readdress the question surrounding the likely cause of the fish kills via the study of fish kill data obtained from both the Neuse River and the Pamlico River systems, adjacent coastal rivers in NC, along with other abiotic factor, environmental data. Fish data was obtained for an 11-year period for the 11 year period, 1985 to 1995, was examined.
Data and Methodology
Figure 1 and Figure 2 provide a composite of the geographic locations of the two lower river-estuarine basins and the cumulative fish kill data. The lower Pamlico River extends from its nominal head at Washington NC down to its mouth and empties into western Pamlico Sound and is to the north of the Neuse River. The Neuse extends from its head at New Bern NC down to its mouth into western Pamlico Sound. Both the Pamlico and Neuse Rivers function as shallow coastal plain estuaries [3,4]. The Pamlico River is relatively straight from its head to its mouth. The Neuse River has an abrupt crook or bend in it at Minnesott Beach. The nominal heads of both river-estuaries are located at approximately the upstream extent of salt water, which derives initially from the adjacent Atlantic Ocean, is advected through the Ocracoke, Hatteras and Oregon Inlets (Figure 1) and then is advected in the bottom waters across Pamlico Sound to the mouths of the two rivers [4].
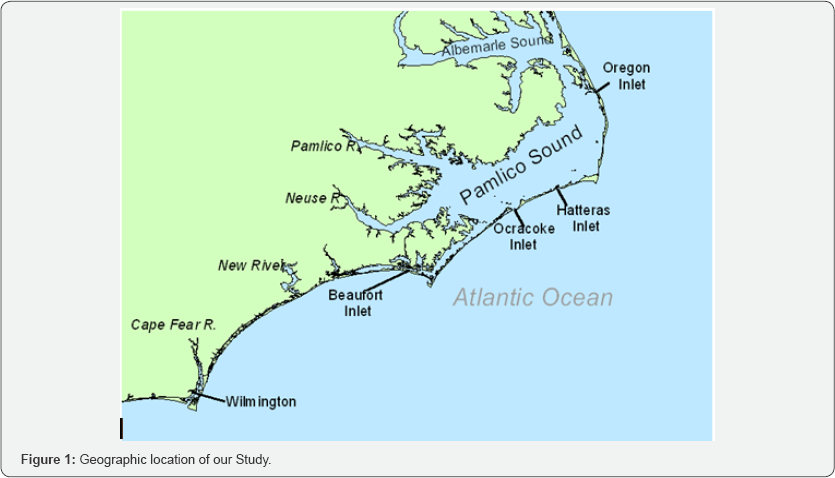
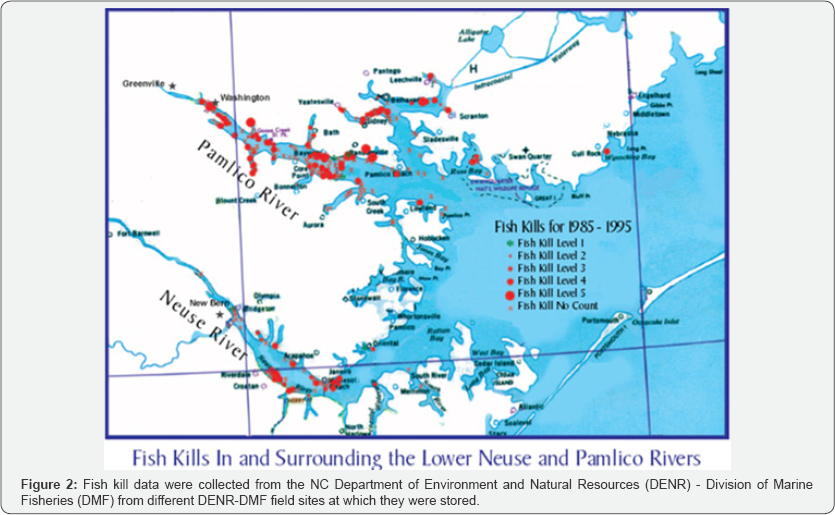
Serendipitously we discovered that the NC Department of Environment and Natural Resources -Division of Marine Fisheries (DENR-DMF) possessed 11 years of fish kill data from the adjacent rivers. We decided to collect all of these data, as could be made available, from the regional and main offices of this state agency DENR-DMF regional offices were contacted and their records concerning fish kills in the geographic areas of interest were requested. At the convenience of the staff located at the regional offices, an NCSU student representative visited and made copies of the files. The files were examined, and the fish kill data was then incorporated into a spreadsheet according to location, date and estimated size of kill, as reported. Environmental factor data were obtained from the National Oceanic & Atmospheric Administration (NOAA) National Centers for Environmental Information (NCEI).
Of particular importance to the collection of the fish kill data were the DENR-DMF Raleigh Office and the Washington (NC) Regional Office. The Raleigh Office is the main office of DENR-DMF, and serves as the central repository for all of the data collected at the regional offices. Regional offices send the information regionally gathered to Raleigh where it is centralized. NCSU representatives examined the files and made copies of documents that were not found in the regional offices. This process allowed for a check and balance on the data sets. However, the process revealed that occasionally regional office data sets and main office data sets differed. Every effort was made by the NCSU representatives and DENR-DMF staff to ensure the correctness and completeness of all data sets.
The fish kill data sets were then compiled into spreadsheets and are provided as a collective overview in both a time-series format as well as in a schematic form (refer to Figures 2-5). All of the annual time series, schematics and data summaries can be provided by the first author of this manuscript. Within the text, the data are summarized and described in terms of the time series as well as in geographic context. In both plotted and contoured forms, the data reveal the frequency and extent of fish kills and should be used as a diagnostic tool. The intent of the study was to examine the fish kills over the 11 year period in the two adjacent coastal river estuaries for their relative experience of fish kills and to determine if there were associated environmental factors that could have played a role in the frequency of occurrence and size of the events. The number of events, as well as size of event recorded, are presented for an 11-year period and assumed to be sufficiently representative. The point of the comparison is dual in purpose; firstly, to probe the health of NC's estuaries in terms of a possible invasion by an alien virus; and secondly to determine if naturally occurring factors or anthropogenic factors could have contributed to the documented fish kills.
Overview and Results
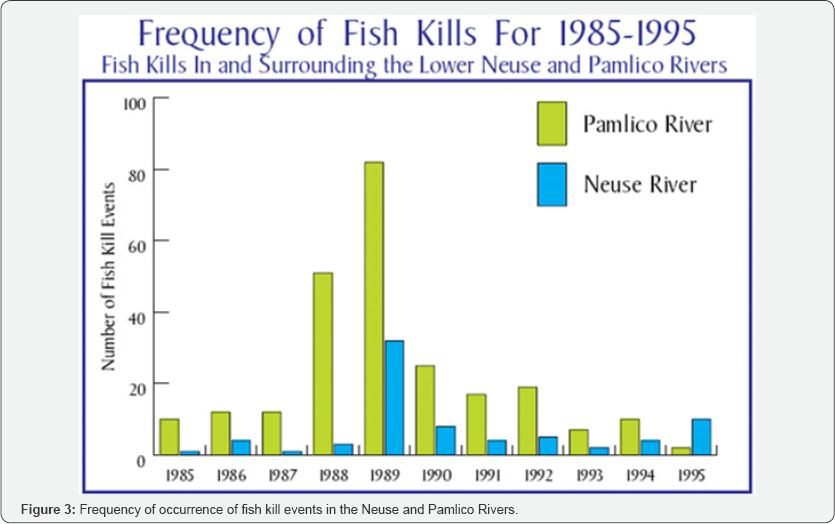
In viewing the 11 years of fish kill data on a year to year basis (Figure 3), the fish kills appeared to have peaked in the late 1980's and then diminished in later years into the middle 1990’s. One likely explanation for the apparent increase in kills in the 1985-1990 time period is the fact that the Pamlico Sound System Emergency Response Team (PERT) was active over this period of time (June 1988-March 1990) but not so active thereafter according to DENR- DMF personnel reports. PERT responded to all kills reported to it. From discussions with DENR-DMF personnel, it appears that in the years following the more active earlier PERT period, less emphasis was given to going into the field to investigate reports of fish kills. So while there may have been comparable number of kills in earlier and later years, fewer kills may have been reported or investigated. There were also a significant number of reports that did not have a count or estimate of the numbers of fish killed. In fact, there were more fish kills in this "no estimate" class than in any other. It is of note that the plotted and geographically configured data (Figures 2-5) presented do not include any fish kills which were the direct and immediate result of a slug of waste or some other contaminant being dumped directly on a patch of fish as a small, localized toxic point source. The measurements of water conditions all come from the deepest part of the river examined at each incident. Extensive kills were located on the maps in the centers. Any other data not known to the authors of this report can easily be folded into this data set, upon discovery and confirmation.
During the period of 1985-1995, the lower Neuse River received a great deal of public, government and private industry attention and scrutiny; particularly in newspaper and news media reports. In fact the news caused a hue and cry for solutions from the NC State Legislature and the previous "NC Department of Environment, Health and Natural Resources (DEHNR)" underwent a name change whereby "Health" was dropped. Alternatively, news reports of fish kill events in the lower Pamlico River were essentially non-existent during this period of time. However, the DENR-DMF records reveal that a significant number of fish kills were realized in both lower river basin. In fact there were more which occurred in the Pamlico River. This came as quite a surprise to the authors of this study.
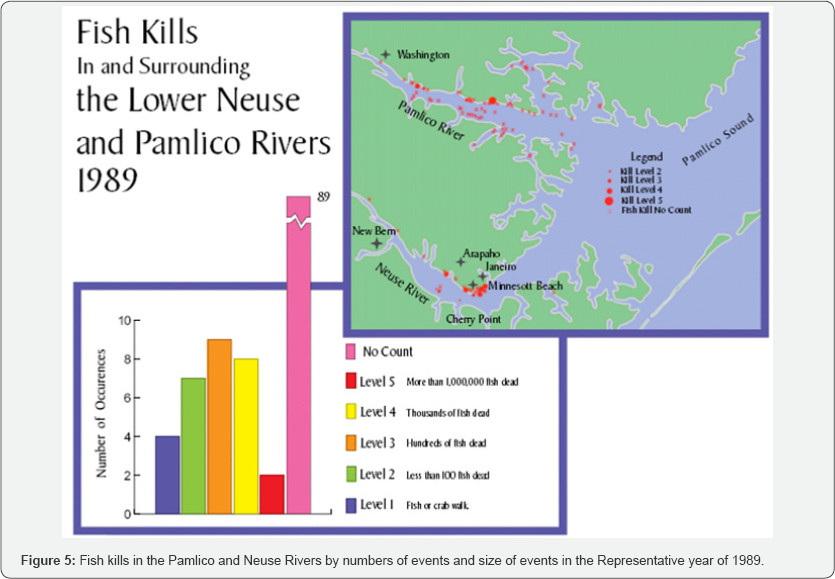
Figure 2 shows the cumulative 11 year data by specific geographic location and magnitude of event. Figure 3 presents an overview of the frequency of occurrence, i.e. the total numbers of reported events, over the 1985-1995 period of time on a year by year and event-size basis. Figure 4 is the cumulative summary over the 11 period by river. Figure 5 is a representative composite of fish kills by event and size for the year 1989 which was the peak year for both rivers; as shown in Figure 2. In the representative Figure 5, number of kills for each river is provided for small (<100), medium (100≤<1000) and large (>1000) are provided. The schematic displays the "kill level" data and geographic location along with the number of occurrences over six different levels (including "no estimates") of fish kills. However, in Figures 2-5 only 319 of the 399 presumed events were considered because of questions regarding 80 of the reports.

Based on the DENR-DMF data sets as representatively shown Figures 2-5, our preliminary summary is:
1. The Pamlico River experienced a higher rate of fish kills of all sizes, than did the Neuse River, in 10 of the 11 years (19851994) of this study, with the exception being 1995.
2. The total number of DENR-DMF reported fish kills in the Pamlico River was 246 over the period 1985-1995, or 22-23 per year.
3. The total number of DENR-DMF reported fish kills in the Neuse River was 73 over the period 1985-1995, or 6-7 per year.
4. The Pamlico River experienced approximately 77% of the total number of fish kills reported for the Pamlico and Neuse Rivers over the period (1985-1995), with the Neuse experiencing 23% of the total;
5. The Pamlico River had a higher rate of incidence of Level 2 sized (<100) fish kills, than did the Neuse for 9 (1985-1992, 1994) of the 11 years, except for 1993, with 1995 a null year.
6. The Pamlico River had a higher rate of incidence of medium, Level 3, sized (100≤ <1000) fish kills for eight of the 11 years (1985-1992, 1994) an equivalent rate for two of the years (1989, 1993) and below in one (1995) than the Neuse River.
7. The Tar-Pamlico River had a higher rate of large, Level 4 (1000 <1,000,000) and the largest Level 5 (>1,000,000) 8 (1985-1988, 1990-1991, 1993-1994) of the 11 years, an equivalent rate in 1992 and a smaller rate in two (1989, 1995) of the 11 years, than did the Neuse River experience.
8. Fish kills in the Neuse River were distributed heterogeneously being concentrated in three principal areas, one on the south bank upstream of Cherry Point NC, near New Bern NC and the other on the north bank between Arapaho NC and Janeiro NC with a hot spot focus at Minnesott Beach NC.
9. Events in which no estimates of the numbers of fish killed outnumbered all other sized events. Further, in 10 of the 11 years (1985-1994), the Pamlico River recorded as many or more "no estimate" events than did the Neuse. The exception was 1995.
10. Fish kills in the Pamlico River are spread throughout the system in a more homogeneous fashion then they were in the Neuse River.
11. Fish kills were not prevalent in the lowest regions of either river, in the areas where the rivers connect to Pamlico Sound.
The lower Pamlico River has all of the attributes of a "coastal plain estuary" [4] and as such has 3 modes of circulation:
a. A top to bottom fresh-water discharge mode, where flow is outward from surface to bottom.
b. A 2-vertical layer fresh-water downstream surface layer and an upstream directed salt water bottom layer and
c. An upstream directed salt water storage mode.
The Pamlico River circulation does not favor either the right or left bank of the river. Alternatively, the lower Neuse River has all of the modes of the Pamlico River but also has a cross-channel flow at the elbow-crick, in the vicinity of Minnesott Beach. The cross channel flow is from the north to the south bank at the surface and from the south to the north bank along the bottom [4]. This pattern tends to concentrate fresher waters on the south bank and saltier water on the north bank.
In a pioneering study, Taylor et al. [5] showed that seasonal winds and the amount of precipitation played a major role in the outcome of Year Class Strength of estuarine dependent finfish (Figure 6). In that study, it was demonstrated that the numbers of juvenile and one to two year old, estuarine dependent finfish that were present in juvenile nurseries in the Neuse and Pamlico Rivers rise during the periods of February through April when winds blowing from the southeast are more persistent (Figure 7a). These winds drive waters that originally came from the adjacent Atlantic Ocean into Pamlico Sound via Ocracoke, Hatteras and Oregon Inlets drive by northeast (Figure 7b) are present. The shelf waters are more saline than the sound waters and thus sink, flowing in a bottom boundary layer into the lower reaches of the two river mouths. Then, with a sufficient amount of spring precipitation, the freshwater flows downstream in a surface layer creating a two- layered circulation.
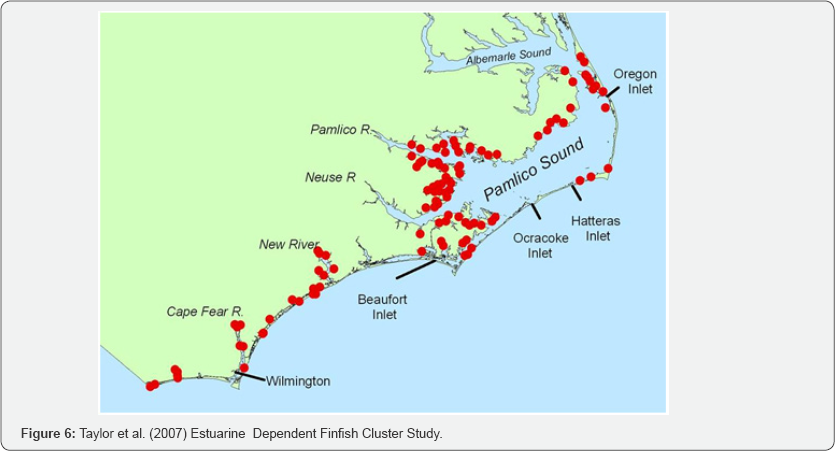

This 2-layered vertical circulation is prevalent throughout the Pamlico River up to the head. In the Neuse River this 2-layered flow also exists but at Minnesott Beach, the elbow creates a cross-channel flow towards the south bank at the surface and a flow towards the north bank along the bottom. In both riverine situations, the systems become strongly vertically stratified, cutting off the supply of oxygen to the bottom layer. Oxygen enters the water columns at the surface interface with the atmosphere and is mixed downward. But, if winds come out of the southeast and bring in salt water to the mouths of the rivers, and then winds blow out of the northwest thereby accelerating freshwater flows downstream in the surface layer, then the vertical integral of the longitudinal density gradient will advect more salt water into system, further strengthening the 2-layered system. Of course this salty bottom layer is also the locale of the ingression of estuarine dependent finfish and it extends into the small tributaries located along the banks of both rivers. What sort of wind event would cause such a transition from Southeasterly (Northwestward) winds followed several days later by Northwesterly (Southeastward) winds?
The answer to the question posed above is: "An Extra-Tropical or Mid-Latitude or Cape Hatteras Low Cyclone". Are these Atmospheric Cyclones prevalent in the vicinity of Pamlico Sound? The short answer is "Yes". In fact 54% of all U.S. Atlantic Seaboard Extra-Tropical Cyclone (ETC) winter storms are spawned from South Carolina to Virginia, centered about Cape Hatteras NC [6]. The structure of an ETC is shown in Figure 8. The numbers of ETCs over a period encompassing the fish kill data are presented in Figure 9. As shown, 1988, 1989 and 1990 were relatively stormy years. 1993-1995 were much less stormy years and the numbers of fish kills also dropped significantly (Figure 3).

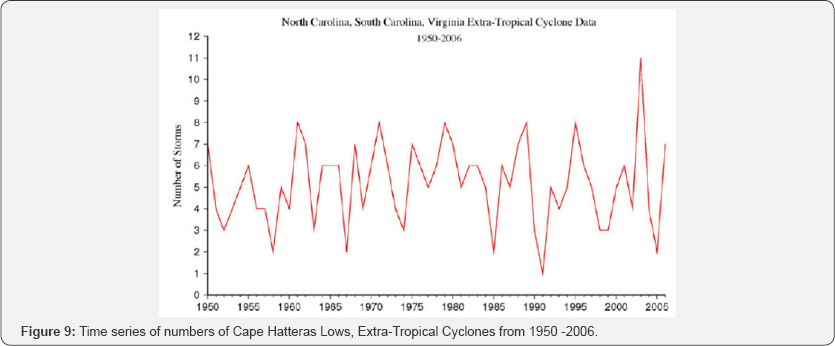
We see in Figure 9 above that over the 57 year period, 19502006, there were between 1 and 12 ETC's per year that were present in the vicinity of the Pamlico Sound system. 1985 was a relatively quiet year with 2, but years 1988, 1989 and 1990 were busy years with 8, 9 and 7 events per year, respectively. The numbers of fish kill events (Figure 2) were approximately 50, 110 and 40 over those years, respectively, decreasing thereafter, in sync with a decrease in the number of ETC storms.
In Figure 10, the three-dimensional numerical model system that was used in Pietrafesa et al. [4] and again in Xie & Pietrafesa [7] was employed to produce the output of the surface and bottom salinities in the Pamlico-Albemarle-Croatan Sound System following the passage of an ETC over the period April 16-19, 2001. The model output clearly depicts the bottom salt water layer below the relatively fresher water surface layer. This is characteristic of a two layer, salt stratified coastal plain estuary [3].

A protocol for estuarine health - fish kills as a symptom
Fish kill events in the Tar-Pamlico and Neuse Rivers and presumably other parts of NC’s estuaries are frustrating for three reasons:
a. They occur in estuarine dependent finfish recruitment and growth periods which flies in the face of the entire abiotic abetted and aided recruitment process;
b. They reveal a lack of understanding of the underlying causes for the kills and
c. They point to an inadequacy or inability to solve problems related to the health of at least two NC river - estuaries.
In truth, fish kills are commonplace in estuaries. However, frequent kills, particularly those of significant size, are symptoms of an unhealthy environment, and NC's estuaries are no exception. Thus any effort to either understand or reduce kills must be multi-faceted. A comprehensive approach to understanding the causes will position present day managers to deal with other, even unforeseen, problems. So here we suggest solutions that will help us deal with other problems as well. An important benefit will come in the future when tough management decisions will be required to restore the health of our estuaries. A scientifically credible basis for these decisions can be provided. In doing so, we make the decisions defensible.
The questions surrounding fish kills are the same as when a human patient dies. What was the cause of death? But the more important question is: what made the patient vulnerable to the cause of death? We must resist the temptation to treat only the symptoms. Fish kills are known to be related to disease, toxins, suffocation, starvation, and other causes. Typically, in the past and to the present, most of the attention has been paid to diseases. However, these diseases are now known to be common in many parts of Pamlico Sound and other NC estuaries as well. So the important question is what conditions cause disease to become virulent? We must consider disease a symptom of a more general environmental deterioration. In fact, there is evidence that Pamlico Sound has become increasingly prone to low oxygen levels owing to nutrient loading, and low oxygen may contribute to the conditions that cause disease to become a problem, but the situation is likely more complex. It will require more than a prescription to restore our estuaries to health. The good news is if we adopt a strategic, rather than a tactical approach to the problem of fish kills, we can position ourselves to understand and prevent other problems before they arise.
The components of a comprehensive program to understand fish kills, as well as to insure the long-term health of our estuaries, must include changes in both research and management. The research community must become more involved and management must be professionalized to a level never before required. New research input from the universities, increased number of fisheries and water quality professionals, and increased local involvement are all required components of a comprehensive plan.
This study constitutes a step in addressing the fish kill problem by pulling together data and information from different sources, both biotic and abiotic. Data on fish kills exist as a result of DENR-DMF investigations, have apparently never been analyzed, integrated, or synthesized. For example, one issue which could and should be addressed is: what fish of what size were killed in relation to fish present at kill sites? The Taylor et al. [5] study of Year Class Recruitments of Estuarine Dependent Finfish includes a Cluster Analysis that selected recruits by species and size. With such information, one could begin to hypothesize about causes, and design investigations to follow such leads. Along with summaries of what we know about the hydrodynamics, the distribution of toxins, particularly oxygen-demanding nutrients, as well as other inputs to our estuaries, one could begin to design a research program to support estuarine management decisions. But these data must be linked from the outset. Most studies of estuaries do not link biological, chemical, geological and physical components. This is a failing which in study design.
For example, hydrodynamics and water quality data collection should be linked to what we know about the physiological and behavioral responses of fish to variations in water conditions. We know low levels of dissolved oxygen typically occur just before dawn, yet we rarely collect data at that time. Knowing the oxygen at noon, or the average oxygen concentration over a month or week or day or even hour is not adequate. Fish suffocate in a few minutes with insufficient oxygen, so we need to monitor oxygen. Also, the supply of land based nutrients used as fertilizers on the farms upstream from and along both rivers has likely been increasing over time and those nutrients fuel biological productivity thus pulling O2 out of the water column leading to toxic algal blooms. To our knowledge temporal and spatial time series of nutrient fluxes have not been conducted system-wide. In summary, we need to summarize and analyze the data we already have, identify data gaps, and proceed to systematically collect needed data. There are federal and state agency field programs across the coastal landscape nationally but few if any have ever been comprehensive in design and execution. Which is why presently we know so little about the functioning our precious estuaries, locally, regionally and nationally.
Although many of the elements are already in place, the infrastructure to link them needs to be improved. Not the least of the necessary changes is to allow the agencies with the responsibility of improving the scientific basis for management the freedom to manage professionally with minimal political interference. This has never been done. The future will be managing inputs and outputs with a scientifically-defensible management plan. However, there is a built-in conflict of interest in charging the scientific and monitoring requirements to improving the knowledge base necessary within the same agency which has a regulatory mission. Here the academic community can be of great service. Universities have much of the critical scientific and technical expertise, but a new infrastructure is needed to make best use of state resources (including universities and staff agencies), through participation in a professionally-crafted management strategy.
Like human health, fisheries depend upon a healthy environment. A healthy estuary for fish has minimal constraints on productive capacity and minimal maintenance costs. The difference between capacity and maintenance costs defines both health and resistance to stress. In a fish kill, either the capacity is lowered or the maintenance costs are raised to the point where resistance is zero. For example, sub-optimal salinity or high temperature raises the maintenance costs for a fish, low oxygen constrains capacity. When oxygen levels fall below that necessary to meet maintenance costs, the fish dies. But before resistance to stress falls to this level, fish are vulnerable to diseases. This more ecological view of health is precisely what is needed for estuaries, but it will require some new information and a new perspective of our estuaries' health. For fisheries and fish kills, there are three main research needs.
i. First, we need to know the distributions of water quality factors.
ii. Second, we need a better understanding of effects of water quality on fish health.
iii. Third, we need to know the impacts of these effects at the population level, i.e., how they must be integrated with traditional management.
Conclusion
The frequency of occurrence and size of fish kills which have been documented over the 11-year period 1985-1995 in two geographically adjacent NC coastal plain riverine estuaries, the lower Neuse River and the lower Tar-Pamlico River, both of which are connected to Pamlico Sound, are presented. While conditions deleterious to the health of fish in the Neuse River have historically received much attention, much less has been heard concerning the health of the Pamlico River. However, DENR-DMF records reveal that of 319 fish kill events reported over the 11 year period, 77% of those occurred in the lower Pamlico River versus 23% in the lower Neuse River. Additionally, kills in the Neuse were concentrated in three more or less distinct areas suggesting localized hot spots while those in the Pamlico were distributed more evenly. This may be a complex function of a coupling of the hydrodynamics to biogeochemical processes and the water quality of the estuarine system. These issues are addressed in this study but, in truth, will remain speculative, problematic and unresolved until a thorough, coordinated, comprehensive field and modeling effort is mounted.
The problem encountered during data collection at the various offices of the DENR-DMF was that the staff in charge of the fish kill data were not always aware of where all the data was located. The main office in Raleigh was supposed to have all of the data that could be found in Washington (NC), but this was not the case. For example, NCSU representatives working with DENR-DMF staff found data in the Raleigh records that were not in the Washington office, and also found data in the Washington office that were not included in the Raleigh records. Some of the reports appeared to have been entered into a computer system. However, none of the staff who were asked about this had any idea of the location of the computer files or if they even existed.
It is time for a new era of fisheries management with significantly improved environmental input, significantly improved data handling, and significantly more input from our universities. Given an improved infrastructure and a high level of trust and cooperation, the management strategy necessary to restore and insure the long-term health and productivity of our estuaries can be crafted and implemented.
For more about Juniper Publishers please click on: https://twitter.com/Juniper_publish
For more about Oceanography & Fisheries please click on: https://juniperpublishers.com/ofoaj/index.php

Comments
Post a Comment