Assessment of Centurial Extreme Coastal Climate of Bethioua Algeria- Juniper Publishers
Juniper Publishers- Journal of Oceanography
Abstract
Nearshore marine climate at the Port of Bethioua, located on the west of Algeria, were studied using real-time field data and climatological offshore data obtained from the UK Met Office. Total waves, swells in the offshore are hind-casted separately and were validated using buoy measurements were supplied by UKMO at a nominal cost. Shallow water wave transformations are modelled using the Teluray wave-current model to calculate shoaling, depth refraction and current refraction taking bathymetry and tidal flows from the TELEMAC flow model as inputs. The results are of particular importance in the context of planning of port and safe anchorage and movement and anchoring of vessels in the harbour area, in addition, for future developmental programs at the port of Bethioua.
Introduction
Waves are of varied forms, frequencies and directions. To arrive at their climatological picture has always been a challenge to harbour engineers from strategic, economic and commercial points of view. The knowledge of sea state is essential in all operational activities in the marine environment, for the safety of public and for design of coastal and marine engineering structures. Efficacy and life of both floating and fixed marine structures and their cost analysis require good estimates of the extreme sea states [1]. Careful assessment of the wind and wave climates, employing good data and reliable analysis techniques, is necessary for the design of all modern deep and coastal ocean infrastructure systems [2]. Height and period of waves are the most important parameters required in ocean engineering designs [3].
In connection with the future developmental programs at the port of Bethioua, studies were carried out on the offshore wind and wave conditions and nearshore wave transformations in the sea off Bethioua to assess the navigation and berth operability perspectives. This paper presents the results of investigations on the winds and temporal and spatial distribution of waves in the nearshore waters of Bethioua, Algeria for 100 years. Wave activity in the port and its environs is of particular importance in the context of design of port, its operation, ship navigation, safe mooring of vessels and transport of cargo in the harbour area.
Materials and Methods
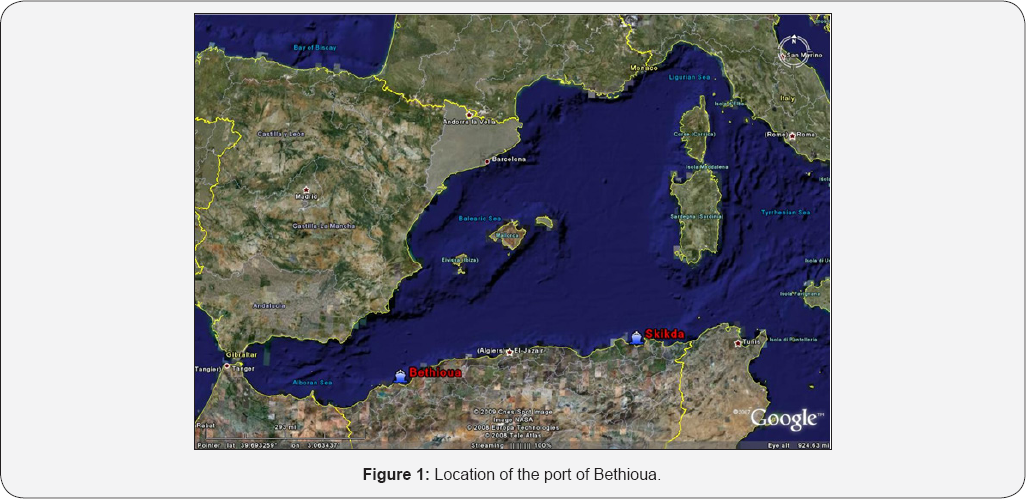
Algeria is in the Maghreb region of North Africa on the Mediterranean coast. The port of Bethioua is located on the west of Algeria. It has a gas terminal, petrochemical facilities and a desalination plant. Figure 1 gives the location of the port of Bethioua. Long term Offshore data were obtained from UK Met Office was used for the coastal process and nearshore wave data analysis. UKMO provides Wave data from operational wave forecasting model re-run in a hindcast mode with calibration against measured data from weather ships and satellites. The model results were also validated using the real-time wave rider buoys measurements. Different components of the wave energy spectrum, for example wind-sea and swell, can propagate naturally and separately, each responding realistically to changes in the wind fields. The full wave directional spectrum, which automatically includes both wind-sea and swell, can be re-constituted as required at each time step and at each grid point. Time series data were collected from offshore observation point located at 36.0 °N, 0.46 °W for twenty-year period from March 1987 to Feb 2006. Three-hourly data on wind speed and direction, significant wave height, mean wave period and mean wave direction are analysed. Data on swells generated by remote storms have been analysed separately as long period swell waves are of particular importance in the movement of moored ships. A similar attempt has earlier been successfully carried out around the Korean peninsula [4] and for the northeast Atlantic European coast [5].
The Met Office (UKMO) Global and European Wave Models represent the ocean surface's elevation due to wind stress as an energy spectrum which parameterizes the non-linear interactions in the wave spectrum. The behavior of the individual spectral components (i.e. their growth and dissipation) can be computed. In each 30 minute time step, the wave energy components move in their respective directions through the a directional spectrum which has 16 and direction (θ m) at each grid point can be integrated out from direction and 13 frequency grid. The significant wave height (Hs), mean wave period (Tm) components.
Shallow water transformations of waves consist of refraction, depth induced breaking and shoaling. Shoaling involves changes in wave height due to the waves slowing down as they travel through water of decreasing depth. Refraction involves gradual change in wave direction as waves travel towards the coast, with the wave crests tending to align more nearly parallel with the seabed contours [6]. Added to these are the influences of tidal currents causing changes in wave height. The current effects on waves are likely to be important where peak tidal velocities exceed about 2m/s [7]. In regions where there are strong tidal currents, the influence of tidal currents on waves (current refraction) is just as important as depth refraction and shoaling. An accurate prediction of the combined effects of depth refraction and current refraction is important in engineering studies in harbours.
Generally, in wave transformation studies selected offshore wave conditions from the probability estimates will be transformed using standard numerical models to study the nearshore wave parameter, which gives biased results. Ultimately, it may cause overestimation/underestimation, hence it increase the error in planning and cost estimation.
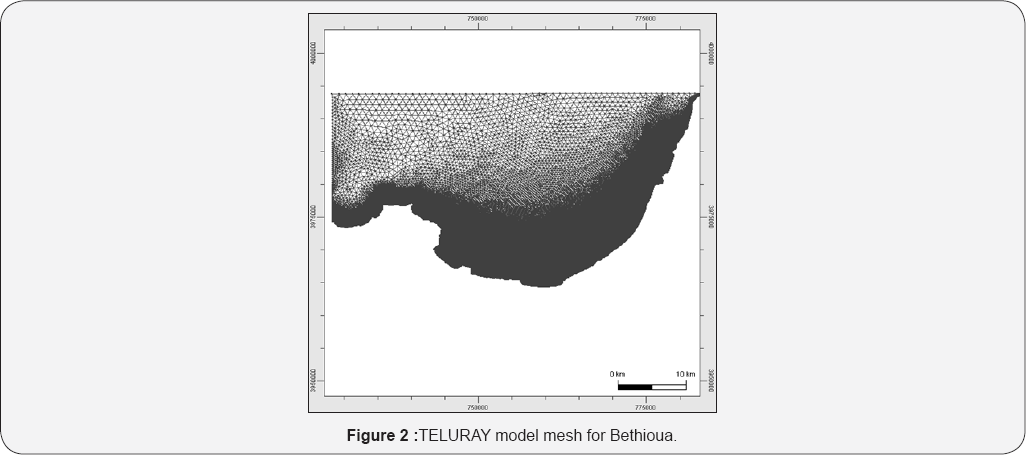
The present study makes use of the Teluray wave-current model to calculate shoaling, depth refraction and current refraction taking bathymetry and tidal flows from the validated TELEMAC2D flow model as inputs. The Teluray model predicts nearshore wave activity by representing the effects of refraction and shoaling on all components of the offshore spectrum using a backtracking ray method. It employs an unstructured finite- element model mesh, which allows the dynamic variation of resolution, so that better resolution can be achieved in areas of particular importance. Figure 2 shows the model mesh for Bethioua.
By this approach, we are transforming each offshore wave ray to the corresponding wave at a neashore point of interest with the influence of all corresponding possible natural agents like wind, tidal variation and processes like shoaling, diffraction etc. Sensitivity tests were conducted to test the model sensitivity to different parameters in the numerical model and were calibrated with available in-situ measurements. Result of the study is a nearshore time series to the corresponding offshore time series at a point of interest. The resultant nearshore time series will be further utilised in estimation of wave parameters for next 100 years using a Weibull fit.
Results and Discussion
Offshore winds
Spatial and seasonal variations in wind and wave conditions are of particular interest when considering safety and ease of manoeuvring and mooring of vessels in the harbour area.
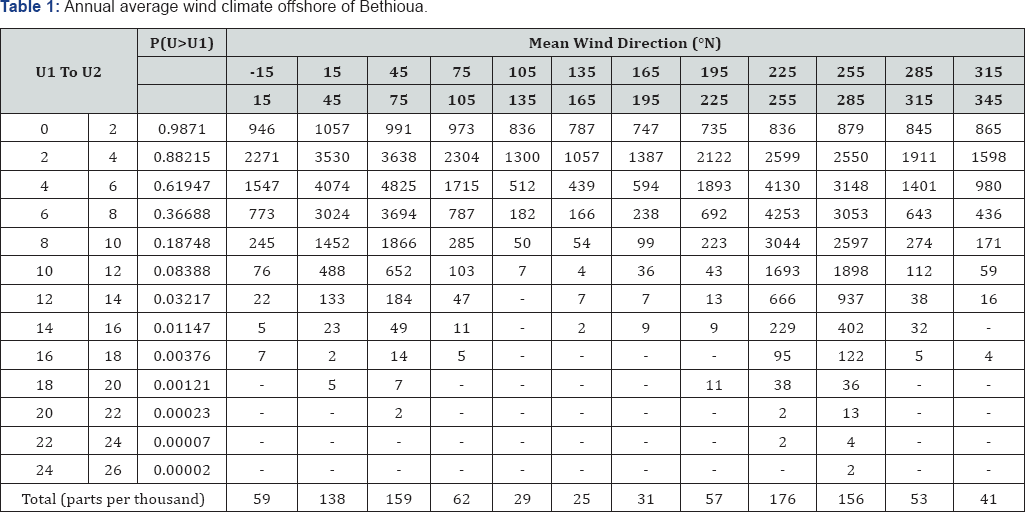
(Data in parts per hundred thousand; U is the hourly averaged wind speed in m/s; P(U>U1) is the probability of U10 exceeding U1).

(Total number of hours in period = 166560).
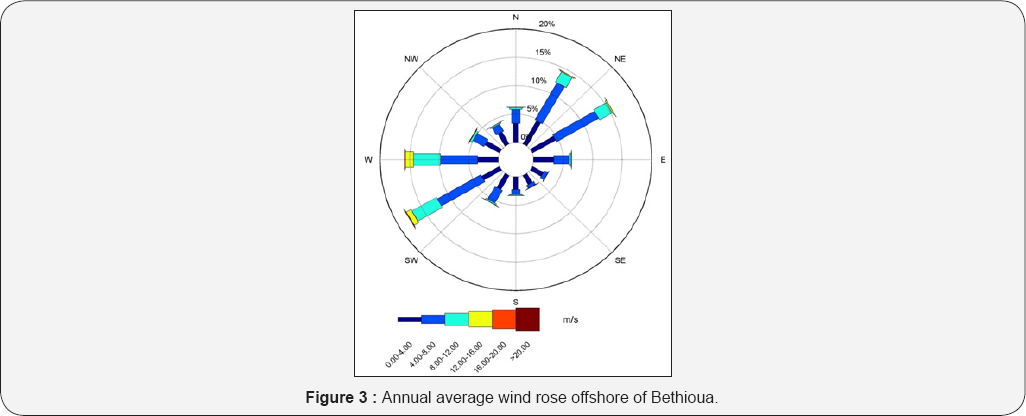
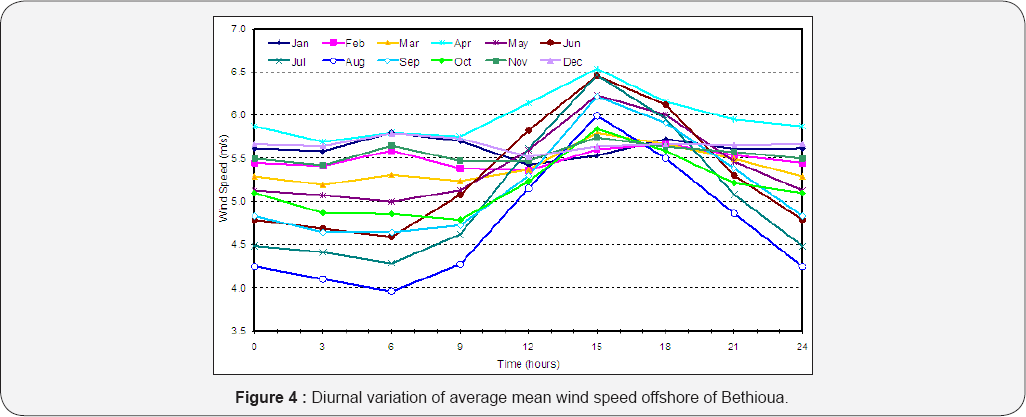
Wind conditions offshore of Bethioua are presented in Figure 3 as a rose diagram. The area is mostly influenced by westerly and northeasterly winds. Winds blowing from the sector centred at 270 °N are the strongest having speeds in the range 24-26m/ s. The most frequently occurring winds are from 240 °N, which account for 18% of records. Table 1 gives the annual average wind climate offshore of Bethioua. Table 2 presents the average monthly probability of exceedence of wind speeds offshore of Bethioua for all the months based on wind data for March 1987 - February 2006. The wind climate of the region consists of two seasons. The winds are strongest during winter months (October-April) and relatively calm during summer months (June-September). Figure 4 presents the diurnal variation of average mean wind speed for all months at the observation point located at 36.0 °N, 0.46 °W. The wind speed shows higher variations during summer with average mean speed reaching a maximum in the afternoon (15:00 GMT) with slower wind in the early morning (06:00 GMT). The greatest variation in mean speed is seen in August with mean speeds ranging between 4.0m/s and 6.0m/s. Diurnal variations are much lower in mean offshore wind speed during winter months.
Offshore waves
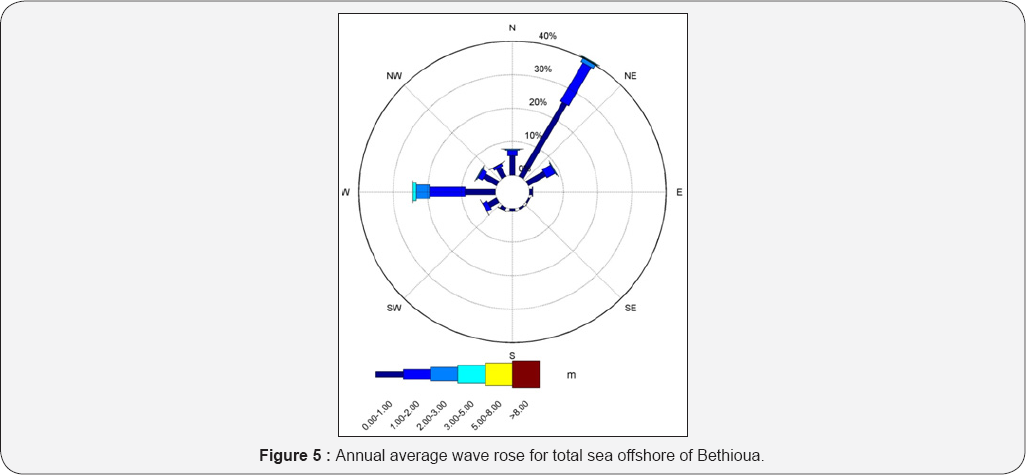
The offshore wave climate is presented in Tables 3-5 as scatter tables of significant wave height (Hs) in metres against mean wave direction, significant wave height against mean wave period (Tm) and significant wave height against hourly averaged mean wind speed (U) in m/s respectively. The data, in parts per hundred thousand, are based on 166560 hours of UKMO predictions for March 1987 - February 2006. Table 3 shows that the wave climate is dominated by waves from the 30 °N sector, which accounts for 39% of wave conditions and waves from the 270 °N sector which accounts for a further 24%. This is consistent with the geometry of the offshore wave generating area in this region. The largest waves occur in the 30 °N sector with waves having Hs 6.5 to 7.0m. The average annual distribution of significant wave heights for total sea offshore of Bethioua is illustrated in the rose diagram presented in Figure 5.
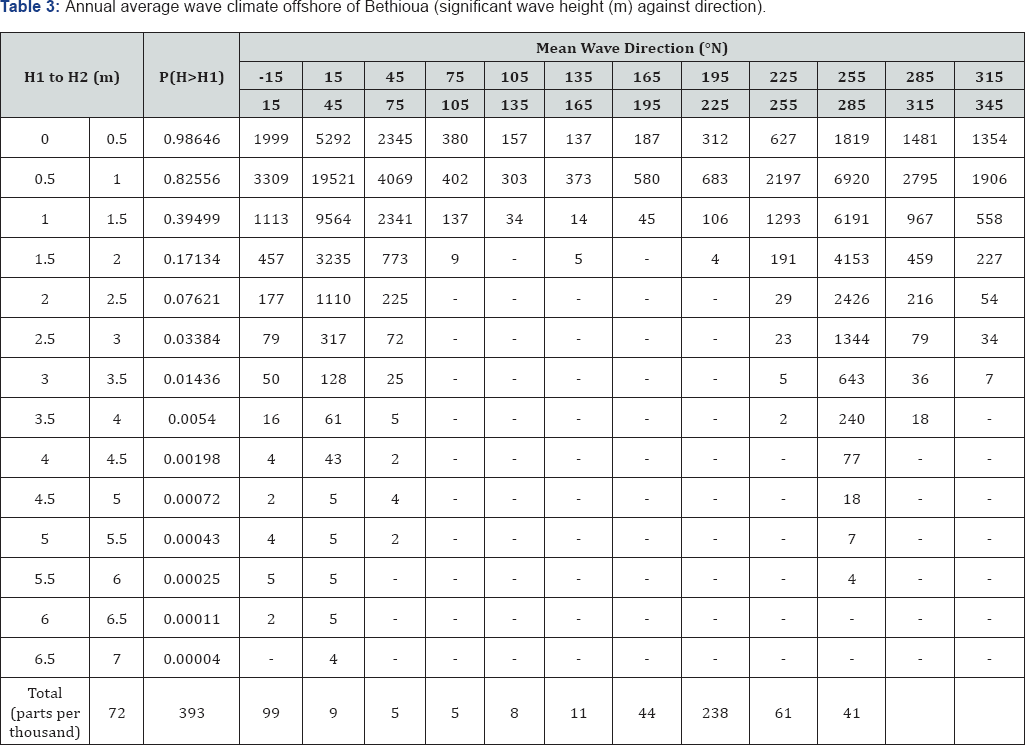
(P(H>H1) is the probability of Hs exceeding H1).

(P(H>H1) is the probability of Hs exceeding H1).
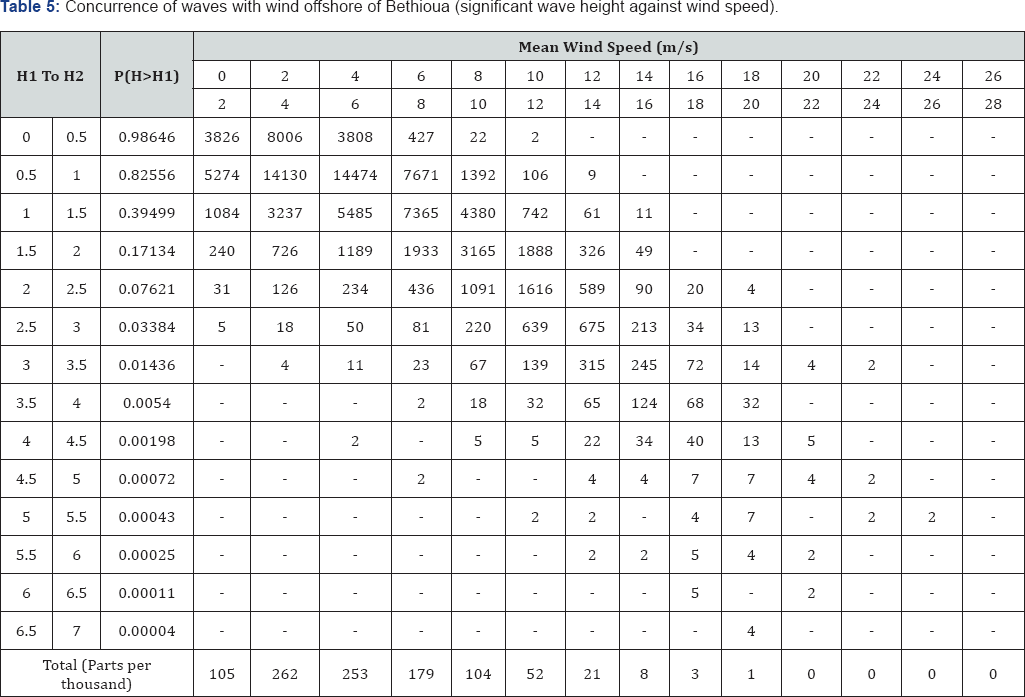
(P(H>H1) is the probability of Hs exceeding H1)
Table 4 indicates that the waves have mean periods mostly in the range of 3 to 7 seconds, although mean periods in the range 7 to 12 seconds are also noted on isolated occasions. The largest waves in the data set have mean periods in the range 8 to 10 seconds. Table 5 shows the concurrence of waves with wind offshore of Bethioiua. As expected, there is a general trend towards larger waves when wind speeds are high. However, there are few occurrences of high waves without high wind speeds suggesting that sea conditions dominated by large swell components are rare. Wave conditions above 4.5m are generally accompanied by winds of 12m/s or greater. Such winds can also be accompanied by significantly lower waves.
Offshore wave scatter tables
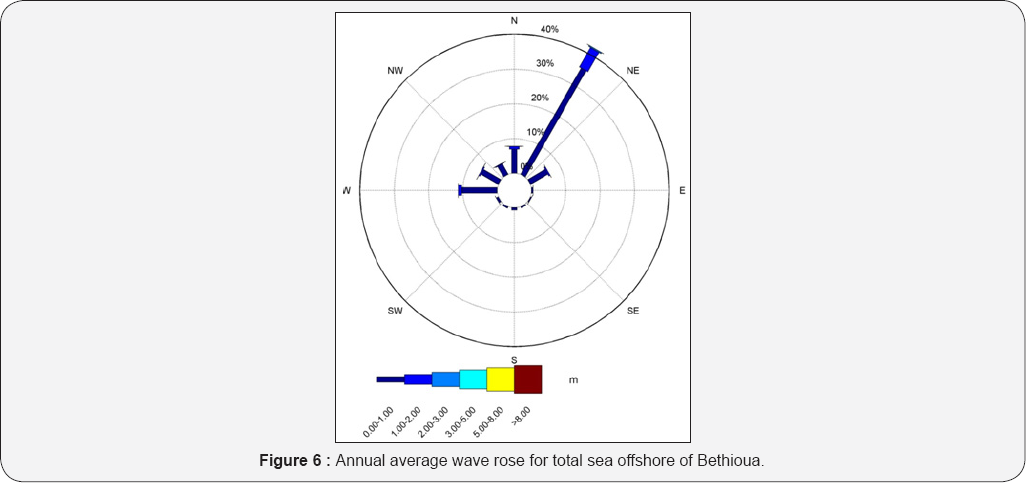
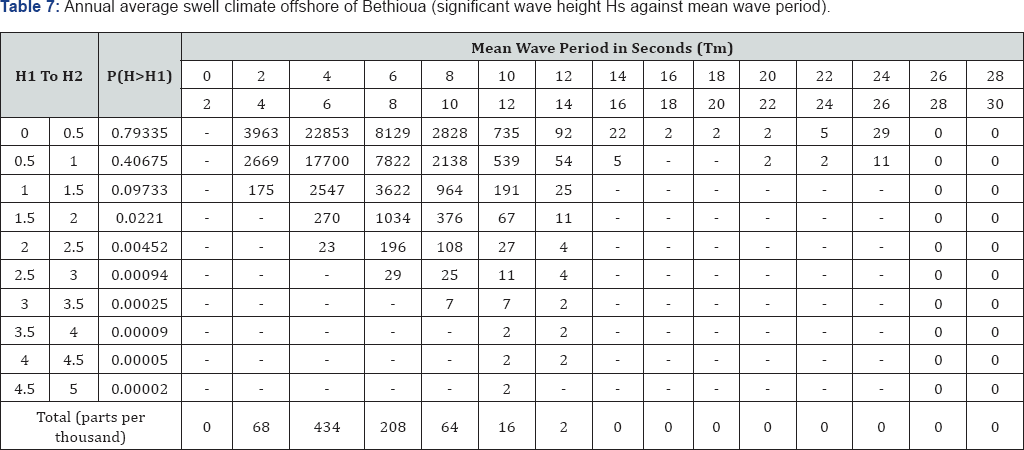
Offshore two-way scatter plots of significant wave height against direction and significant wave height against wave period are given in Tables 6 & 7 respectively. In 41% of the records, the wave climate is heavily dominated by swells from the 30 °N direction sector. This direction sector also produces the largest swells with significant wave heights reaching 4.5 to 5.0m. Figure 6 presents a clear picture of the annual average wave rose for swells offshore of Bethioua. Wind wave periods are in the range of 2 to 10s. The largest swells fall in the range of 10 to 14s. There are also some very long period swells in the range Tm = 14 to 26s, although these have relatively low wave heights (Hs < 1m).
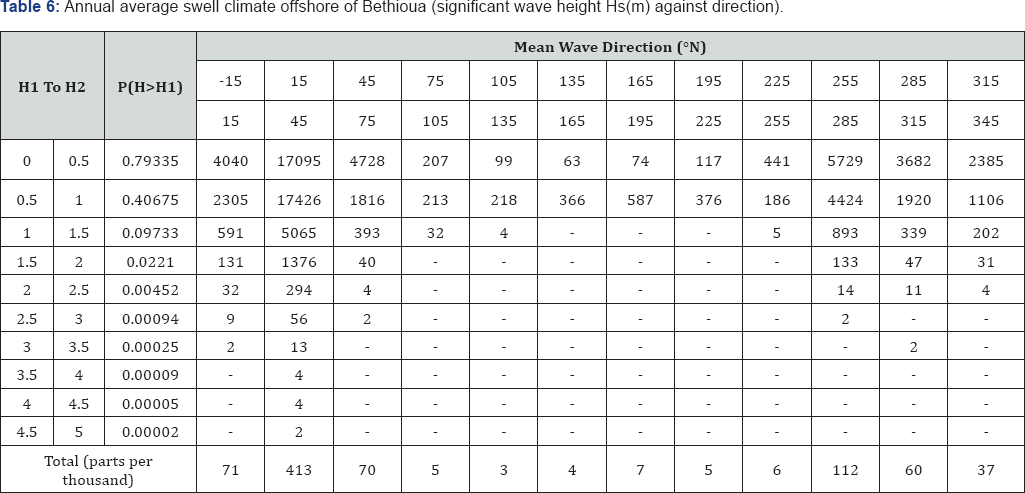
Based on UKMO predictions for March 1987 - February 2006; P(H>H1) is the probability of Hs exceeding H1.
Extreme offshore conditions
Extreme wind and wave conditions offshore of Bethioua are obtained by fitting probability distributions to the data. It is well accepted that the three-parameter Weibull distribution generally fits this type of data. Extreme conditions have been derived by fitting Weibull distributions to the sectors of interest for return periods of 1, 5, 10, 50 and 100 years. Table 8 presents the estimated extreme wind speeds offshore of Bethioua. The most severe winds are predicted in the sector centred at 270 °N. Estimated wind speed of return period one year is 19.2m/s and 25.1m/s is the corresponding wind speed for the return period of 100 years.


Total extreme offshore sea waves at Bethioua are presented in Table 9. Most severe waves approach from the sector centred at 60 °N. The 1-year return period for this direction is predicted to be Hs = 4.6m, increasing to 7.7m for the 100-year event. For the higher return periods, similar wave heights are indicated from the 30 °N sector. Extreme swell conditions offshore of Bethioua are presented in Table 10. The most severe swell components occur in the 30 °N sector, giving a 1 in 1-year component of Hs = 3.0m, rising to a 1 in 100-year swell component of Hs = 4.9m.

Shallow water wave transformations
As waves propagate from deep water into the shallow water, all the wave parameters, except wave period get modified by shallow water processes including refraction, and shoaling [8]. The sheltering effect of the surrounding coastline may also be important in determining nearshore wave climate. The Teluray wave transformation model provides and effective and convenient tool to model these processes. This model predicts wave activity at nearshore sites by representing the effects of refraction and shoaling on all components of a given offshore wave spectrum by using an efficient backtracking ray method. This method involves the tracking of wave rays from the nearshore point to the offshore boundary of a grid system covering the area of study. Since the ray paths are reversible, each ray gives information on the energy propagation towards the shore. This method is used to transform long-term offshore wave time series data to nearshore time series in presence of tidal variation and natural wave transformations as it travels from offsh0re to nearshore.
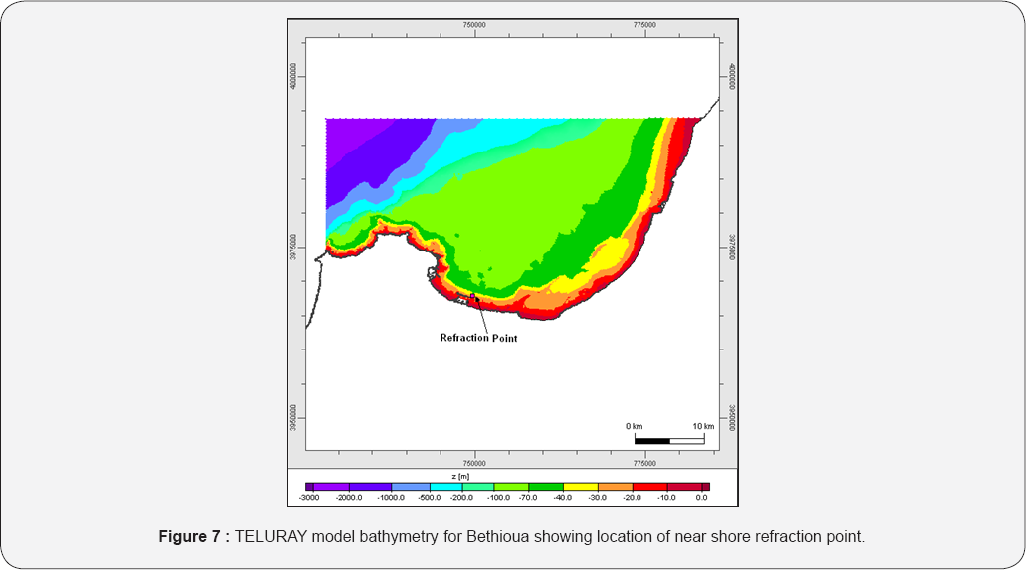
Figure 7 shows the model bathymetry for Bethioua extracted from a digitised global bathymetry database based on latest navigation charts. The Teluray model uses dynamically varying unstructured finite-element model mesh that provides greater resolution in areas of particular importance. Figure 8 shows the model mesh for Bethioua. The co-ordinate system for the model is UTM Zone 30N (WGS84). The nearshore refraction point for Bethioua was located at 749723mE, 3967867mN in a depth of -30mCD. The wave transformation simulations for Bethioua are carried out using a still water level of +0.5mCD, approximately equal to the local mean sea level with corresponding tidal current. The JONSWAP spectrum was assumed for the offshore wave conditions. This is a reasonable assumption for an enclosed sea area such as the western Mediterranean where local winds are dominant. Peak period for the standard JONSWAP spectrum is given by 1.28 times Tm.
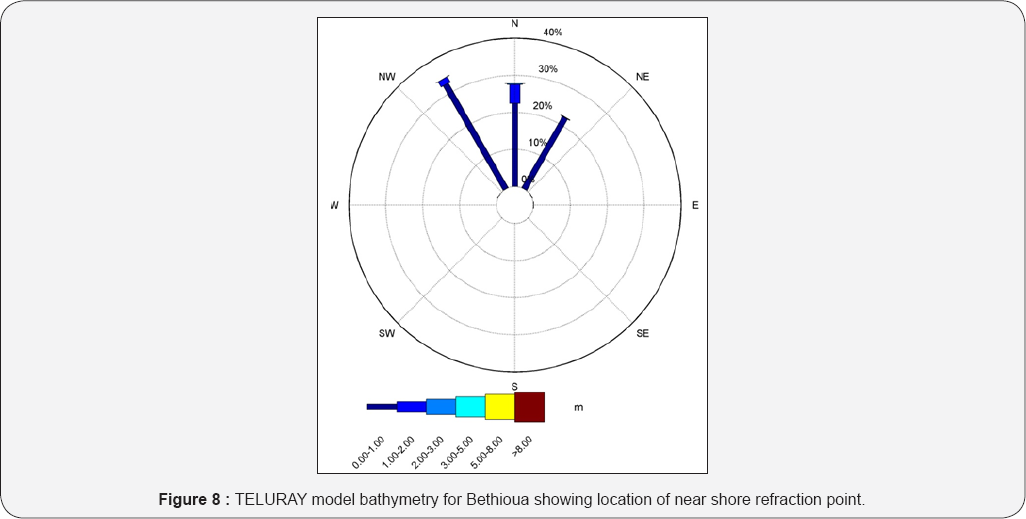
The total wave climate nearshore at Bethioua is dominated by waves from directions between 10°N and 30 °N (Figure 9). These waves account for about 50% of the wave records. There is a secondary peak from around 330°N. The largest wave approach is from directions between 10 °N and 20 °N, having Hs between 5.0 and 5.5m predicted in the 20-year data set. Nearshore peak periods are typically around 1.38 times Tm.

The swell wave component nearshore at Bethioua is presented in Figure 9 as a wave rose plot. Again, the climate is dominated by waves arriving from 10 °N - 30 °N which account for about 45% of nearshore wave records. The largest swell components also approach the Port of Bethioua from 10 °N - 20 °N, reaching the range Hs = 3.5 to 4.0m in the 20-year data set. To validate the teleuray results we have considered extremes. Calculated offshore extremes are modelled with help of wave propagation model SWAN. SWAN results are then compared with nearshore extremes from the teluray model.
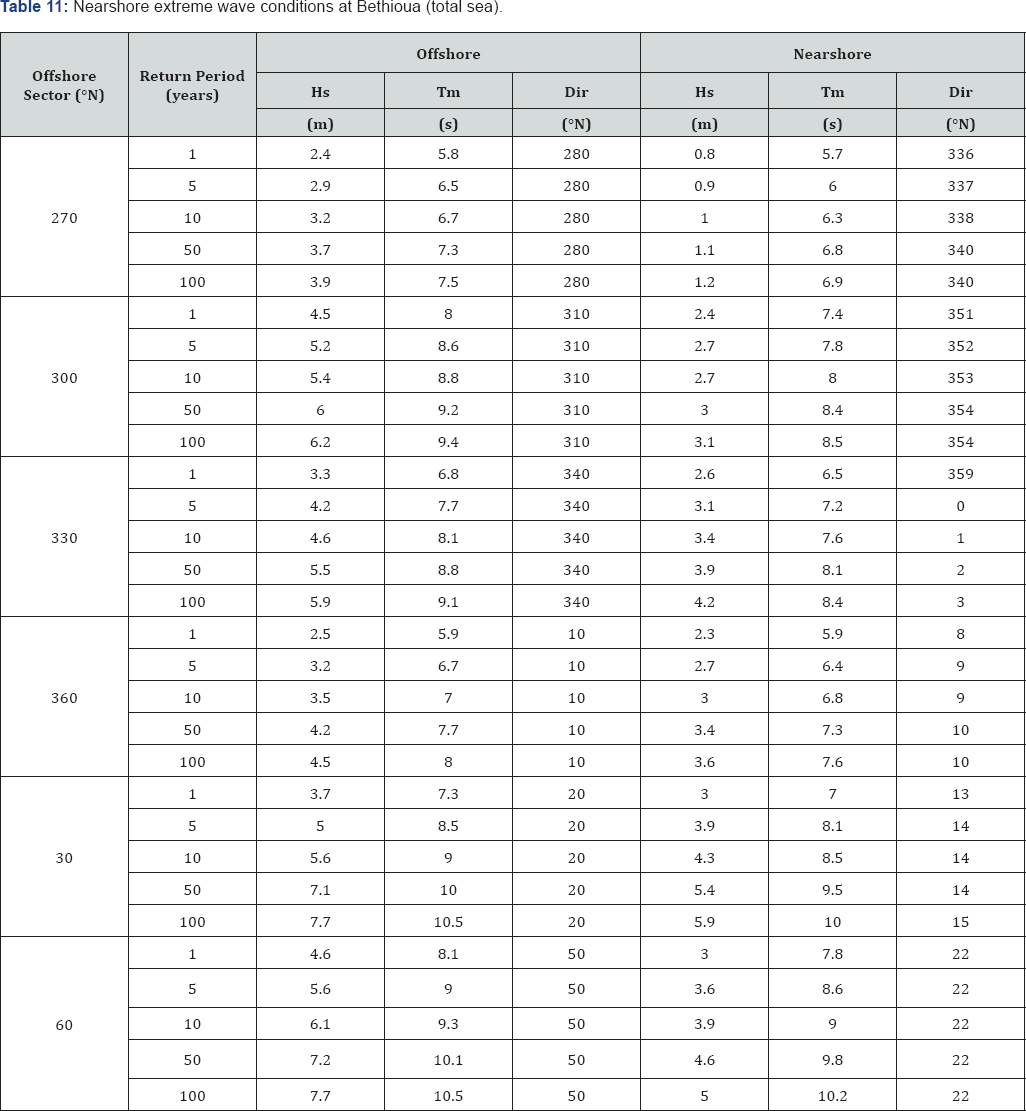
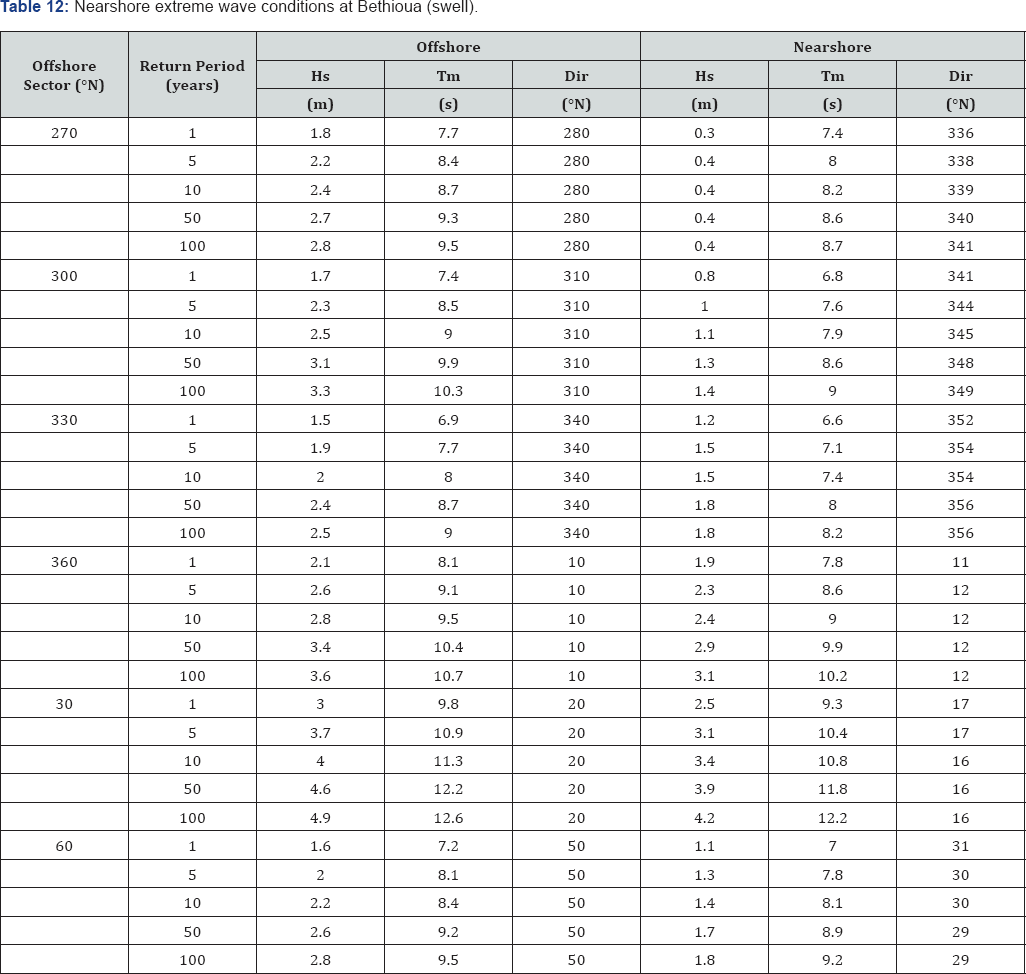
To compare the validity of nearshore extremes estimated after transforming the entire. In addition to transforming the time series wave data, the Teluray model is used to transform the extreme wave conditions to nearshore. For each offshore direction sector, the predicted extreme wave condition is applied with directions corresponding to the centre of the sector and 10 degrees on either side. The largest resulting nearshore extreme waves for each sector are then selected. The near shore extreme wave conditions are presented in Table 11 for total sea conditions. The most severe near shore waves are those arriving from the sector centred at 30 °N. For this sector, a 1-year return period wave height Hs = 3.0m is predicted with a near shore direction of 13 °N, increasing to Hs = 5.9m with near shore direction of 15 °N for a return period of 100 years. Nearshore extreme swell component predictions are presented in Table 12. As expected, the largest extreme swell components are caused by offshore waves from the directions centred at 30 °N. For this sector, a 1-year return period swell height Hs = 2.5m is predicted with nearshore direction of 17 °N, increasing to Hs = 4.2m with a direction of 16 °N for a return period of 100 years.
Conclusion
Transformation all offshore time series wave data to nearshore point of interest gave more realistic and reasonable results compared to the conventional practice of transforming selected wave rays to nearshore for estimating long-term extremes. The method adopted considered all time-dependant metocean parameters to transform offshore time series waves to nearshore time series. Offshore wind and wave data obtained from the UK Met Office are analysed for a point at 36.0 °N, 0.46 °W. The offshore wind climate is dominated by westerly and northeasterly winds. The strongest winds come from the sector centred at 270 °N, with maximum speeds in the range 24-26m/s.
The waves offshore at Bethioua are dominated by waves from the sectors centred at 30 °N and 270 °N. The largest waves occur in the 30 °N sector with waves predicted up to Hs=6.5 to 7.0m. The waves have mean periods in the range of 3-7 seconds. Mean periods in the range 7 to 12 seconds are also observed on isolated occasions. In the nearshore at Bethioua, the largest extreme wave heights are predicted in the sector centred at 60 °N. The 1-year return period condition for this direction is found to be Hs = 4.6m, increasing to 7.7m for the 100-year event.
The most severe nearshore waves are caused by offshore waves arriving from ~ 30 °N. These waves have a 1-year return period wave height Hs = 3.0m with a nearshore direction of 13 °N, increasing to Hs = 5.9m with near shore direction of 15 °N for a return period of 100 years.
To update
I. Graphs with Teluray and direct Teluray exceedance
II. Downtime estimate with two methods
III. Sensitivity and validation tests
IV. About the friction terms
V. Telemac-teluray coupling
VI. Update the write-up with graphs
VII. Literature
Comments
Post a Comment