Forecasting Tropical Cyclogenesis with a Global Mesoscale Model: Results for Six Tropical Cyclones in May 2002- Juniper Publishers
Juniper Publishers- Journal of Oceanography
Abstract
Recent advances in global weather modeling and supercomputing technologies have led to promising simulations of tropical cyclones (TCs) that improve our understanding of the impact of scale interactions on model’s predictability. In this mini review, we document the model’s performance in simulating the genesis of six TCs in association with a large -scale tropical convective system that can be identified as an eastward moving Madden-Julian Oscillation (MJO) in May 2002. It is shown that the genesis of the six TCs can be predicted two or three days in advance, supporting the hypothesis that a large-scale system (i.e., the MJO in this case) may provide determinism in the simulation of TC precursors. The current study and earlier studies motivate us to revisit the fundamental role of the butterfly effect in the system’s stability within high-dimensional Lorenz models and global weather/climate models, which is subject to a future study.
Keywords: Butterfly effect; Global mesoscale model; Prediction and predictability; Scale interactions; Tropical cyclone formation
Introduction
Recent extreme weather events in the United States, such as Hurricanes Katrina [1] and Sandy [2] (e.g., [1,2]), have emphasized the need for reliable, state-of-the-art weather forecasting models. At the same time, advances in supercomputing technologies [3] have led to significant improvements in global climate modeling, and the accompanying simulations reveal remarkable details of tropical cyclone simulations that have shown a potential of improving our understanding of the role of the hierarchical multiscale processes as well as butterfly effects in model’s stability.
The original butterfly effect was defined as the sensitive dependence of numerical results on initial conditions (ICs) in the pioneering model study by Prof. Lorenz [4]. This effect was referred to as the first kind of butterfly effect by Shen [5] and Lorenz’s model is referred to as the three-dimensional Lorenz model (3DLM). During the past 50 years, numerous studies have been conducted regarding chaotic responses that may have significant impact on the prediction of weather and climate, in particular hurricanes. Since small-scale processes are less predictable than large-scale processes, errors associated with small-scale processes may “quickly” contaminate simulations of large-scale flows. Hence, the outlook for extending prediction lead times beyond 5-7 days has not been optimistic (e.g., [6]). By comparison, recent studies using multi-year data analysis (e.g., [7,8]) and modeling simulations [1,2,9-15] have been conducted in order to understand to what extent the high intrinsic predictability (of TC genesis) may exist and how realistic the corresponding practical predictability (of a model) can be obtained. Specifically, the role of hierarchical multiscale processes associated with large-scale processes (e.g., tropical waves) in the predictability of mesoscale TCs has been investigated. The multiscale processes include
- Downscaling processes associated with modulation due to large-scale flows such as Madden Julian Oscillation [16] or African Easterly Waves (AEWs; [17]), and
- Upscaling processes associated with feedbacks from small-scale processes such as convection or precipitation.
It was hypothesized that the lead time of TC genesis prediction could be extended if a model can realistically simulate the evolution of large-scale processes (in the form as a precursor) and their modulation on TC activities, and feedbacks by small-scale resolved and parameterized processes. Our recent modeling studies [1,2,9-15] have shown that a large-scale system (e.g., tropical waves) can provide determinism on the prediction of TC genesis, making it possible to extend the lead time of genesis predictions. Selected cases in our studies include the relationship between
- TC Nargis (2008) and an Equatorial Rossby (ER) wave;
- Hurricane Helene (2006) and an AEW;
- Twin TCs (2002) and a mixed Rossby-gravity wave (MRG, e.g., [18]) during an active phase of an MJO;
- Hurricane Sandy (2012) and upper-level tropical waves associated with an MJO (e.g., [2,14,19]).
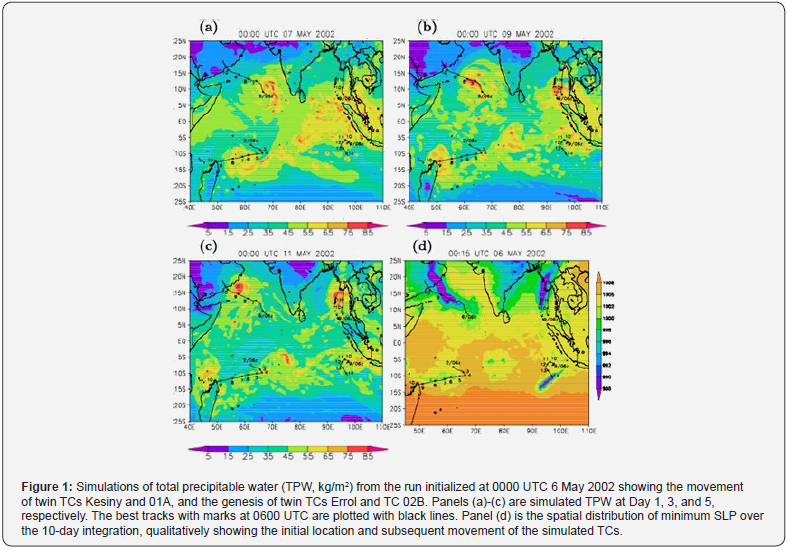
In this review, we provide additional cases in support of the conceptual model for the role of multiscale processes in TC genesis. In early May 2002, large-scale organized convection associated with an MJO event was observed in the Indian Ocean (Figure 1a). While the MJO was continuously progressing eastward, six TCs appeared sequentially, including two pairs of twin TCs (e.g., Figure 2 of Shen et al. [14]) in the Indian Ocean in early and middle May, one typhoon to the west Pacific in middle May and one hurricane to the east Pacific in late May. By using the global mesoscale model [9,10], we present numerical results to illustrate model’s ability in simulating the formation of the 6 TCs. The basic model configurations in control runs, which are discussed in Shen et al. [9,10], include a 1/4 degree resolution and a large-scale condensation scheme that enables latent heat release from the grid- scale condensation processes when cumulus parameterizations (CPs) are disabled. Additionally, parallel experiments with varying model physics (e.g., using different CPs) are performed for verification purposes (but are not documented in this study). The best tracks of these TCs are available from the Joint Typhoon Warning Center and National Hurricane Center and are plotted with black lines for comparison. QuikSCAT 0.5o seawinds data are used for verification but not shown.
Discussion
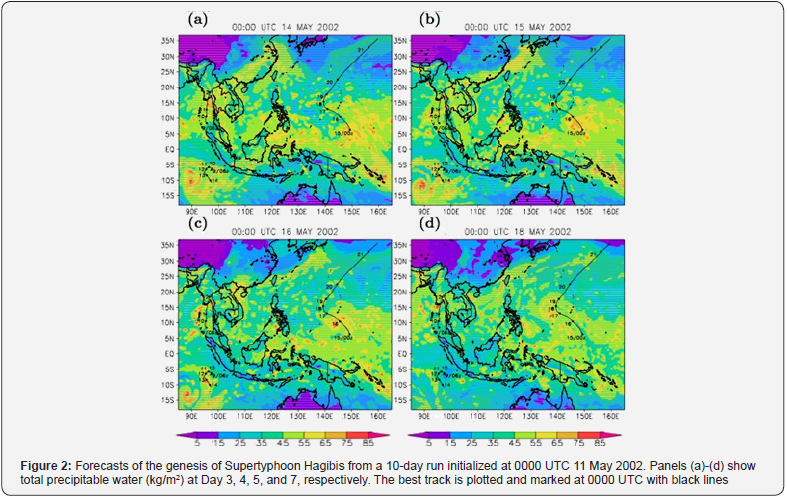
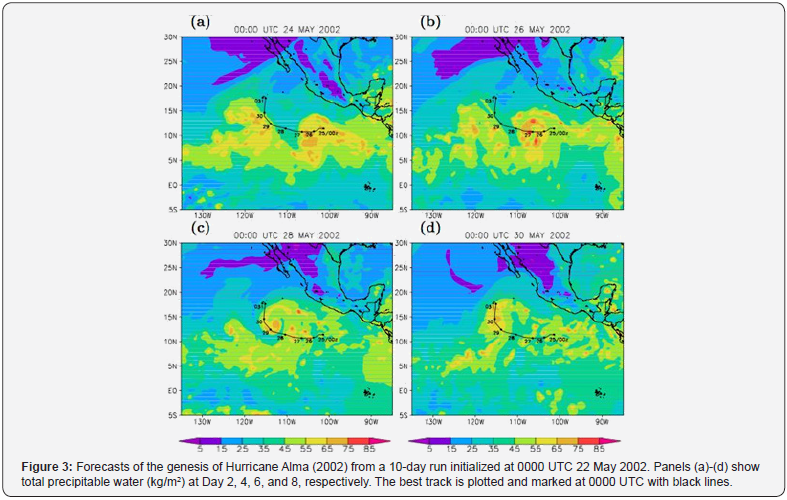
Appearing sequentially in association with the eastwardmoving MJO in May 2002, six TCs include two pairs of twin TCs in the Indian Ocean (e.g., Figure 2 of Shen et al. [14]), one typhoon to the west Pacific and one hurricane to the east Pacific. Figures 1-3 display numerical results to illustrate the model’s performance in simulating these TCs. Additionally, a using the Coupled Advanced Modeling and Visualization system (CAMVis; see details in Shen et al. [12,15]), we create a 4-panel animation to visualize the time evolution of the formation for each of the TCs. The animation is available https://goo.gl/9dqcsK. Results are discussed below.


Twin TCs Kesiny (3-11 May) and 01A (6-10 May)
The first pair of twin TCs, consisting of TCs Kesiny and 01A, appeared in early May 2002. The TC Formation Alert for Kesiny (2002) was first issued at 2100 UTC 2 May, and moved crossed the northern part of Madagascar on 9 May. TC 01A was first recorded at 1800 UTC on 6 May and made landfall near Salalah, Oman on May 10. Remarkable genesis simulations of the two TCs were analyzed in detail by Shen et al. [14]. The first panel of the animation shows the formation of these two TCs.
Twin TCs Errol (9-14 May) and TC 02B (9-12 May)
The second pair of twin TCs, Errol and TC 02B, was observed during 9-14 May (Figure 1). Being the southern member of the twin, Errol was first named on 9 May north of Cocos Island. During its entire lifetime, Errol meandered in a very limited area between 6.6 °S -10.8°S and 94.6 °E - 97.6 °E. At 0600 UTC 09 May, TC 02B was first noted near (8.4 °N; 95.5 °E). This storm moved northward under the influence of a mid-level ridge to its east. It made landfall at 2300 UTC 11 May south of Yangan near (16.8 °N, 96.2 °E).
For this case, initial conditions at 0000 UTC 6 May was used to perform a 10-day forecast. As shown in Figure 1a-1c, the genesis and subsequent movement of TC 02B in the North Indian Ocean are simulated quite well. In contrast, only less-organized convection in the South Indian Ocean, which might be identified as Errol, is simulated during the first 5 days of integration. The genesis of Errol is simulated at a later time with a larger displacement error compared to the other three TCs. For the first pair of twin TCs (TC 01A and Kesiny), which are included in the specific initial conditions, the predicted movement is quite good, but the modeled TC 01A moves slower than was observed, which might be due to the vortex spin-up problem. The top right panel of the animation shows the time evolution of the simulation for this case.
It is worth mentioning that there is a good agreement between the simulations (Figure 1b) and satellite observations (e.g., Figure 2 of Shen et al. [14]) for the four major convective events, namely the 4 TCs. However, a false-positive convective event also appears along longitude 80oE. By performing two additional experiments with different cumulus parameterizations (e.g., Shen et al. [14] and references therein), it is found that this event is sensitive to the choice of particular model moist physics (not shown).
Supertyphoon Hagibis (15-21 May)
As the MJO continued to propagate eastward, it was reasonable to expect a third pair of twin TCs along 150-160 °E to develop around mid-May. However, only one TC, called Hagibis, developed in the north hemisphere. It was first noted near the Caroline Islands within a broad monsoon trough at 0000 UTC 15 May. It moved northwestward under the influence of a midlevel ridge, recurved sharply to the northeast during 18-19 May,experienced extra-tropical transition, and finally merged with an extra-tropical low. As shown in Figure 2, a run initialized at 0000 UTC 11 May captured the location of the TC’s genesis and its subsequent movement quite well until May 18, indicating a lead time of 7 days. However, the model TC recurved smoothly compared to the sharp curvature of the observed storm. The bottom left panel of the animation shows the time evolution of the simulation for this run.
Hurricane Alma (25 May-1 June)
Hurricane Alma appeared as a tropical depression at 1800 UTC 24 May in the east Pacific. Although its formation might have been due to the interaction between a tropical wave and northeasterly flow from a gale in the Gulf of Tehuantepec [20], the MJO’s impact is also noted. Alma moved westward and strengthened into a tropical storm two days later. It then became a hurricane on 28 May, turned northward on 29 May, and reached Category 3 intensity with a minimum sea level pressure (MSLP) of 960hPa on 30 May. It began to weaken after entering a sheared environment over cool waters. Figure 3 shows the evolution of two mesoscale vortices and their interaction from a run initialized at 0000 UTC 22 May. A precursor (the eastern vortex) to genesis appeared on 23 May; it then became organized and strengthened to become Alma. The location of the precursor on 23 May is close to the one depicted by QuikSCAT. Alma gradually intensified and turned northward on 29 May after the western vortex moved close to Alma and weakened. The time evolution of the simulation for this case is shown in the bottom right panel of the animation. Note that the interaction between these binary vortices within the same counterclockwise circulation is fundamentally different from that of twin TCs and will be subject to further investigation.
Conclusion
In this review, simulations are presented of cyclogenesis for six TCs that occurred in association with an MJO in May 2002 using a global mesoscale model. Four 10-day forecasts show that the genesis of 3 of these TCs is simulated reasonably well about 2 to 3 days in advance. In addition, forecasts of subsequent TC movement are also accurate. However, the genesis forecast of TC Errol is less accurate; it meandered within a very limited area during its entire life cycle. All of the results suggest that the occurrence of a large-scale MJO and its accompanying westerly wind burst appears to dictate the location and timing for TC genesis. The results appear to be consistent with our hypothesis on the role of persistent forcing associated with large-scale flows in determining the timing and location of TC formation. However, further analysis on the detailed transition processes among the different scales is still needed.
Based on the current study and previous studies (e.g., Shen et al. [1,2,9-15]), it can be stated that improving long-term simulations of large-scale processes with high-resolution GCMs could enhance the ability to predict TC genesis. By comparison,the reportedly promising practical predictability for real-world models leads to a challenging question: Are our simulations consistent with chaos theory? Alternatively speaking, it is important understand to under which conditions small chaotic processes may predominantly impact the accuracy of numerical solutions. To address the questions, we made an attempt at understanding the dependence of chaotic solutions on model’s formula and model’s configurations by deriving high-dimensional Lorenz models (LMs; e.g., Shen [5, 21-24]). Our analysis of the high-dimensional LMs suggested that an increased degree of model’s nonlinearity (e.g., via increasing a model’s resolution or coupling an additional physics based model component) may improve a practical predictability. Depending on model’s parameters and configurations, the 3DLM and high-dimensional LMs could have different types of solutions, such as steadystate, chaotic or limit cycle solutions, which could have different predictability. A future work is to understand whether some or all of the solutions may appear in real-world models and which solution(s) may better describe the nature of weather [24].
To Know More About Journal of Oceanography Please Click on: https://juniperpublishers.com/ofoaj/index.php
Comments
Post a Comment