Assessment and Mitigation of Natural Disasters for Sustainable Livelihoods of Coastal Communities in the Maheshkhali Island, Bangladesh- Juniper Publishers
Juniper Publishers- Journal of Oceanography
Abstract
Being a disaster-prone country, nearly one million people have been killed in Bangladesh by cyclones since 1820. Cyclonic storms have always been a major concern to coastal plains and offshore islands of Bangladesh. At least 54 damaging cyclones were reported in the coastal area of Bangladesh from 1793 to 2009 estimating once in every 4 years. Coastal community of Moheshkhali Island is adversely affected by natural disasters since time immemorial. Community livelihood data collected with 309 questionnaires from household heads of eight vulnerable and exposed coastal villages and 24 focused group discussion representing various social groups of the Island is the important milestone of the study. Fishing with traditional boat and gear in the Bay of Bengal was identified as the main income generation option of men where sea salt extraction, agriculture, trading and day labor were found as supporting occupations. Family care and cooking food are the prime duty of women. Early marriage, multi-marriage and dowry system have been recognized in the island. Most of the houses are bamboo fence and mud wall with straw roof having poor sanitary system. Coastal erosion, tidal surge, salinity increase, fisheries decline and anomalies in weather pattern were identified as the most severe problems where as absence of cyclone shelter, lack of road network, shortage of primary school and absence of hospital facility in the locality were other problems. Data analysis revealed that embankment construction in exposed coastal zone with mangrove plantation, weather forecasting in local language, life jackets in fishing boat, solar panel for electricity supply, health facilities with medical centers, cyclone shelter during disaster events and enhanced education program are essential. Temperature and sunshine illustrated increasing trends where as rainfall and humidity showed decreasing trends over the two decades showing clear indication of warming the environment that coincided with global trends.
Keywords: Natural disasters; Cyclonic storm; Climate change; Community livelihoods
Introduction
Bangladesh is a disaster-prone country. Nearly one million people have been killed in Bangladesh by cyclones since 1820 [1] due to there being an estimated 10% of the world’s cyclones developing in the Indian Ocean [2]. The physiology, morphology and other natural conditions have made it vulnerable to disaster, cyclonic storms and floods which cause immense suffering and damage to the people and property of the offshore islands of Bangladesh. The cyclone accompanied with torrential rain and devastating tidal surge causes havoc to human lives, livestock’s, fisheries, agricultural properties and loss of houses, break-down of sanitation system, non-availability of safe drinking water and food stuff in the affected area. In islands and coastal mainland’s of Bangladesh the major aftermaths of a cyclone are loss of human lives, livestock’s, fisheries, agricultural properties and production, inundation of land and ponds by saline water, loss of houses, break-down of sanitation system, non-availability of safe drinking water and food stuff. The calamity brings in a major and sudden change in the ecosystem and it takes a long time for restoration [3]. Approximately 45 damaging cyclones were reported in the coastal area of Bangladesh from 1793 through May 1997. Thus cyclone frequency during this period averaged about once in every 4.5 years [4]. It is recognized that sustainable resource utilization requires training and education in all levels of the society, where indigenous people and their communities have a vital role in environmental management and development using their knowledge and traditional practices [5]. Involvement of local communities in management gives them a sense of awareness of the resources and ensures their continued livelihood and economic well-being. In this way, the development of the coastal islands links ecology with economics, sociology and politics, promoting policies and practices which discourage further degradation, establish priorities, provide incentives for improvement and provide sufficient resources for local people.
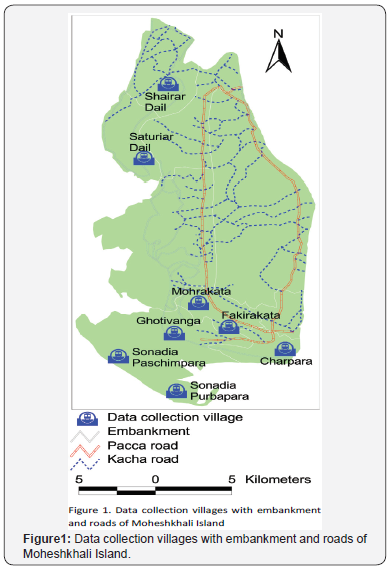
Moheshkhali Island lies near the Cox’s Bazar coast. The length of the island is about 20km in north-south direction and they are about 12km wide in east-west direction and the geographical location is in between latitude 21°20 and 21°50 N, and longitude 91°45 and 92 °E (Figure 1). It is surrounded by the Moheshkhali channel to the east, the Bay of Bengal to the south and west and Kutubdia Island to the north. There are numerous micro channels and creeks criss-crossing the island. Most of them are tidal and suitable for navigation. According to the population census in 2001, there were 43,000 households in Moheshkhali Thana and the total population of these households was 246,000 with 52.44% male and 47.56% female [6]. The coastal island communities are almost totally cut off from the rest of the country. The people of the study area do not have adequate access to health, family planning, schooling, infrastructure and electricity. A large proportion of the community is illiterate; average literacy rate is 28.8% with 32.5% male and 25.1% female. Television is expensive and in the absence of electricity often does not reach remote communities. In such a situation their only real access to information and news is radio and inter-personal communication [7]. Women are not involved directly in primary production sectors but perform fisheries-related activities such as unloading, sorting, gutting, net mending, processing and marketing. Women’s involvement in shore-based activities in small-scale fisheries is most evident in the seafood-processing sectors. Other economic activities involving extensive women’s participation are fish trading and marketing.
Materials and Methods
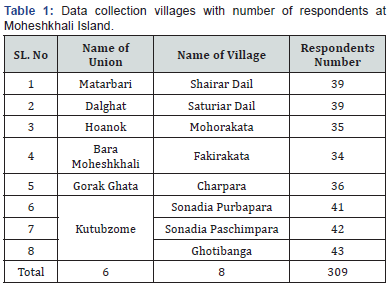
Extensive field visit and interviewing of fishermen household heads of 8 selected coastal villages were used to collect primary information on different livelihood assets (Table 1). The fishermen’s livelihood related data have been collected with 309 household heads using questionnaire and 24 focused group discussion representing various social groups, such as sex, age, wealth, and education level following the approaches of Pido [8], Pido et al. [9], Townsley [10], IIRR [11] and Hossain et al. [12]. While various exposures to fishermen resilience (livelihood) have been reviewed through secondary data and research papers, people’s perception are also important to consider their behaviour and responsive actions [13]. It was discussed about social, economic and environmental resources and for individuals to learn about their own and others perceptions surrounding these resources. In addition to handwritten, photograph was used as effective media for conveying results of the interview. Interviews with key informants such as school teachers, fishery officers, forestry officers, village leaders, NGO extension workers, mosque imams aimed at
a. Identification of the assets and analyze their relative importance to the fishermen livelihood,
b. Detection of the most vulnerable areas and any known adaptation mechanisms and
c. Collection and examination of past and present records of disasters associated with climate variability. During the visits to the villages participatory observations were used to study the natural environment, housing conditions, social custom and villager’s life style.
Data collection
Eight exposed and vulnerable coastal villages from different unions of Moheshkhali Island were selected for data collection (Figure 1 & Table 1). A total of 309 household heads participated in the data collection process.
Data analysis and interpretation
The process of data analysis and interpretation happens on multiple scales using personal computer. Properly collected and archived data continues to be useful as new research questions emerge. In fact, some research involves re-analysis of data with new techniques, different ways of looking at the data, or combining the results of several studies. Making data available to other scientists is not a new idea, but having that data available on the Internet in a searchable format has revolutionized the way that scientists can interact with the data, allowing for research efforts that would have been impossible before. This collective pooling of data also allows for new kinds of analysis and interpretation on global scales and over long periods of time. In addition, making data easily accessible helps promote interdisciplinary research by opening the doors to exploration by diverse scientists in many fields.
Observations and Results
Socio-economic condition
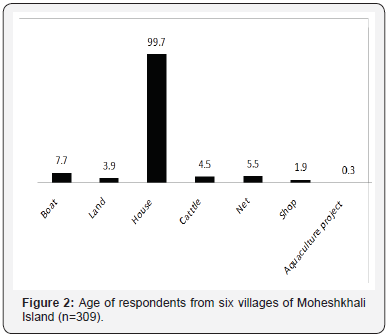
Age of respondents: A total of 231 household heads have participated through questionnaire survey. The age of about 80% respondents varied between 30 to 60 years, where less than 5% respondents were below 30 years and about 15% respondents were above 60 years (Figure 2).
Education level: Most of the household heads are illiterate in all the six villages with 69 to 98 % (Table 2). Data analysis revealed that average 86% are illiterate, where primary, secondary and college level educations are 3, 8 and 2 % respectively.

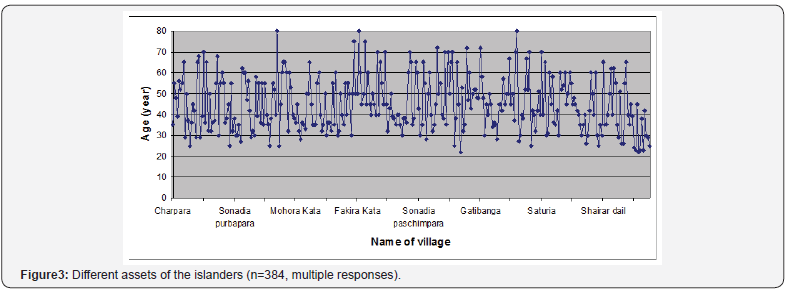
Household assets: The respondents ranked house as the most important asset (99.6%), where the household members lived in. The boat and net are used to catch fishes from the Bay of Bengal and considered as the main income generating assets of the islanders. Some of the households have small pieces of land that have been used either agriculture or sea salt production. Some of the islanders rear cattle and sell meat or milk to get cash income. A few household had shop in the locality. The owner of aquaculture project was quite invisible among the villagers (Figure 3).
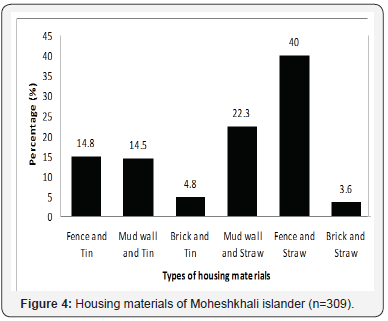
Housing materials: Housing condition of the islanders was the appearance how poor they are. About 40% houses were found bamboo fence with straw roof. Mud wall with straw roof were about 21%. Bamboo fence and mud wall with corrugated sheet (locally called tin) were found about 18% and 13% respectively (Figure 4).
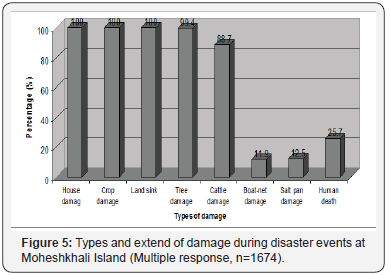
Extent of damage during disaster events: House damage, crop damage, salinity intrusion and tree damage were found as the most severe damages during disaster events (Figure 5). About 85% cattle died. Boat, net and salt pan were identified as minimum damaged items.
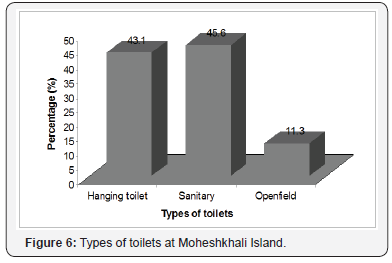
Toilet facilities: About 55% households used simple sanitary toilet, where about 30% used hanging toilet and 15% used open field (Figure 6).
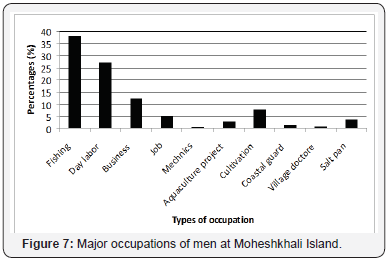
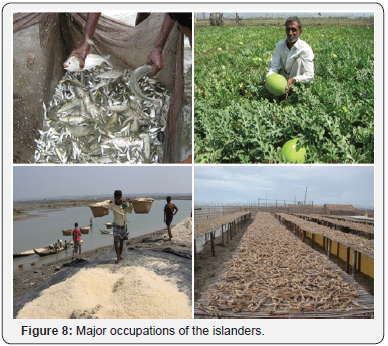
Men occupations: Fishing was identified as the main income generation option of men with about 50% weight (Figures 7 & 8). Day labour, trading and agriculture were subsequent occupations with about 17, 16 and 10%.
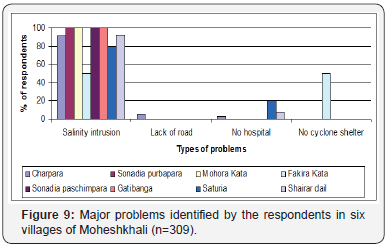
Problems identification: Salinity intrusion was identified as the most severe problem in all the eight villages. All the respondents (100%) from Sonadia purbapara, Mohora Kata, Sonadia paschimpara and Gatibanga mentioned salinity intrusion as the only problem, where 92% and 50% respondents from Charpara and Fakira Kata village respectively ranked salinity intrusion as the top most problems (Figure 9). The respondents of Fakira Kata village also mentioned about the absence of cyclone shelter, where only 6% and 3% respondents from Charpara village reported lack of road network and absence of hospital in the locality.
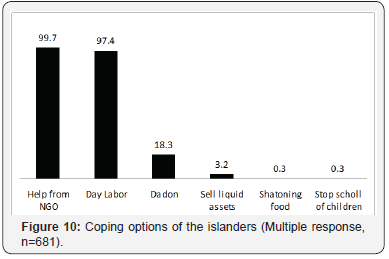
Coping strategies: The main coping options of the fishermen are taking loan from the NGOs and changing occupation as day labourer that represent 99.1% and 97.4% respectively with multiple response (Figure 10). The presence of moneylenders (locally called Dadonder) covered 18.6% with the condition of selling the harvest at lower price.
Resource mapping: Resource Mapping is a method for collating and plotting information on the occurrence, distribution, access and use of resources within the economic and cultural domain of a specific community. Outputs may differ according to the specific purpose the exercise is conducted for and to the characteristics of participants. Resource mapping is ideally preceded by a resource historical transect, which provides for a preliminary checklist of resource-related issues relevant to the community. Resource mapping should be conducted at the onset of a community based activity, but only after rapport has been established with the community. Knowledge on the social structure of the participating community is a prerequisite for the facilitator. This is because the community may consider resource distribution, use and access as sensitive issues.
Community resource mapping is sometimes referred to as asset mapping or environmental scanning. Community resource mapping is best noted as a system-building process used by many different groups at many different stages in order to align resources and policies in relation to specific system goals, strategies, and expected outcomes. When combined with community information, resource maps can provide a comprehensive picture of a community’s vision, goals, projects, and infrastructure (Appendix II). In short, community resource mapping can help communities to accomplish a number of goals, including:
i. Identifying new resources;
ii. Insuring that all youth have access to the resources they need;
iii. Avoiding duplication of services and resources;
iv. Cultivating new partnerships and relationships;
v. Providing information across agencies that work with youth; and
vi. Encouraging collaboration.
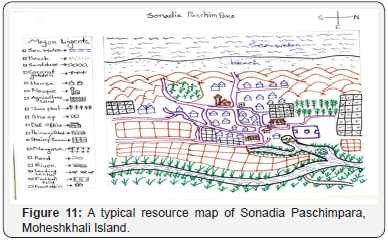
The major resources of the islanders are crop land, salt pan, accreted land, mangrove forest and aquatic ecosystem of the Bay of Bengal. The example of a typical resource map of Sonadia Paschimpara is shown in Figure 11.
Seasonal activities: Every fruit or vegetable has its season, the time of the year when people can enjoy it at its very best. This simple tool will guide us through what’s in season when so we can enjoy fruit and vegetable that taste better, is better value and is better for the planet.
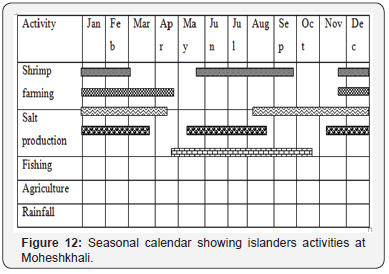
Most of the occupations are seasonal at Moheshkhali Island (Figure 12). Except for trading, no year round activities were found in this coastal island. Shrimp farming is practiced in different seasons in two different zones i.e., in tidal lands during the winter season and in plain lands during rainy season. Both the plain lands and the tidal lands have been used for sea salt production during the winter season due to the high evaporation rate in November to April when the temperature is high, skies are clear and the windy season is in full progress. The island communities have taken full advantages of this seasonal variation to establish a salt evaporation industry. The island’s catch fish from the nearby canals, rivers and the Bay of Bengal for their own consumption and also for selling almost round the year, except for the period of heavy rain (May to July) when there is rough weather and cyclonic storms associated with the southwest monsoon winds. Paddy is cultivated mainly in plain land during rainy season. Seasonal vegetable, peanuts, watermelon, and betel leaf grows in plain lands and hill slopes during the winter season.
Women occupation: About 100% women of the villages were found as housewife (Table 3). Only 2-3% has been engaged in secondary occupation as fry collector, school teacher and UP Member.
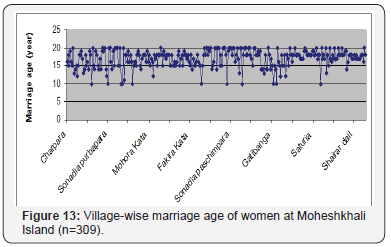
Marriage age of women: Women marriage age varied from 10 to 20 years in all the six villages of Moheshkhali Island (Figure 13). About 40% girls got married within the age of 10-15 years, where the remaining 60% became wife at the age of 15-20 years old.
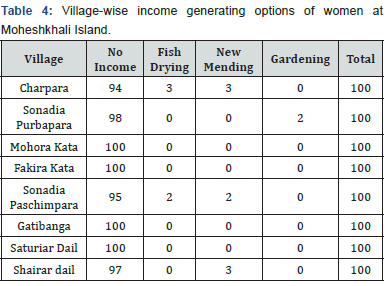
Income generation of women: The women are not directly involved with income generating activities at Moheshkhali Island (Table 4). Women mainly takes care children, collecting drinking water and cooking food for the family, which has been remained unheard and unpaid for sine time immorial.
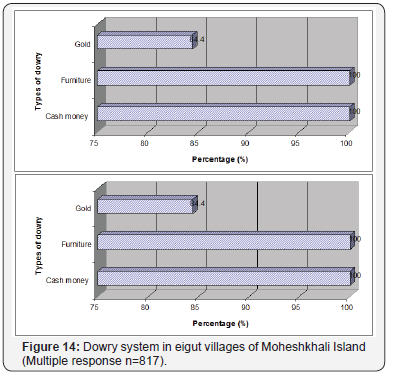
Dowry system: The women’s guardian has to pay dowry to the men’s guardian during marriage ceremony. The respondents reported three categories of dowry such as cash money, furniture and gold (Figure 14)
Meteorological data analysis
Rainfall: The increase in temperature and evapotranspiration combined with the change of rainfall pattern has induced a notable water deficit with a negative impact on agricultural production and socio-economic conditions (Touazi et al 2004). Variability in rainfall pattern, resulting from changes in global climate can rapidly reduce productivity; alter the composition of agricultural crops and finally creating a significant problem in environmental control. While regular rainfall pattern is vital to healthy plants, too much or too little rainfall can be harmful, even devastating to crop. Emitted heat by human activities leads to change in rainfall pattern, both in amounts and intensity. Global warming is also causing changes in the precipitation pattern globally. As a result of climate change more work is now being done on climate indices rainfall. The research concerning rainfall variations in coastal catchments of Bangladesh shows a lack of attention. The purpose of the present study is analysis of the rainfall variation and study the future trend of rainfall in Cox’s Bazar coast.
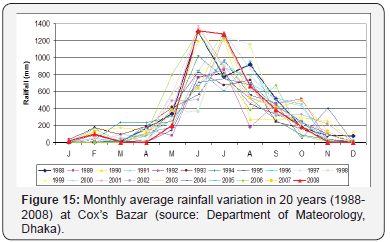
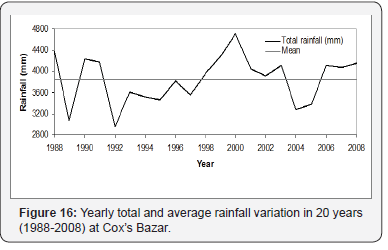
Most of the rainfall concentrated between May to October in Cox’s Bazar coastal region (Figure 15). Though the rainfall variations are irregular in 20 years duration but it is clearly indicate the decreasing trends over the decades. Yearly total rainfall varies between 2953 and 4709mm with average 3852mm in 20 years duration (Figure 16). The highest rainfall was recorded in 2000 where the lowest was in 1992 at Cox’s Bazar coast.
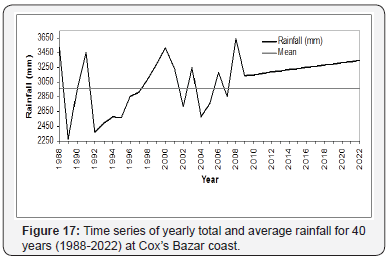
The time series analysis showed increasing trends of total annual rainfall at Cox’s Bazar coast. The average value was measured 2956mm for 40 years duration (1998-2022). The predicted value for 2022 was 3348mm (Figure 17).
Temperature: Global warming increases the average temperature of Earth’s near-surface air and oceans. According to the 2007 fourth assessment report by the Intergovernmental Panel on Climate Change (IPCC), global surface temperature increased 0.74±0.18 °C during the 20th century. Expressed as a linear trend, this temperature rose by 0.74±0.18 °C over the period 1906-2005. The rate of warming over the last half of that period was almost doubles that for the period as a whole (0.13±0.03 °C per decade, versus 0.07±0.02 °C per decade).

The box plot for monthly average temperature has been plotted for the periods of 1988-2008 in Figure 18. The box plot showed higher temperature during March to October, where the temperature became lower in November to February. April and May were the warmest months for the last 20 years at Cox’s Bazar coast. The «whiskers» are lines that extend from the box to the highest and lowest range of temperature.
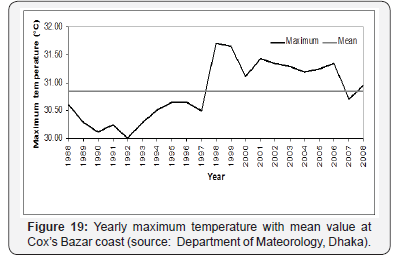
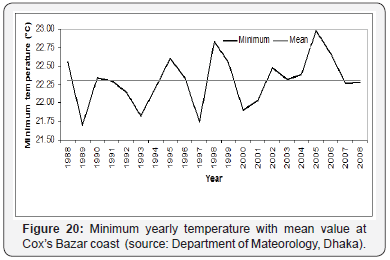
The yearly average maximum temperature clearly showed increasing trends between 30-32 °C (Figure 19), where the average minimum temperature showed irregular tends between 21.50-23.00 °C (Figure 20). The mean maximum and mean minimum temperature were recorded 30.85 and 22.31 °C respectively. The yearly average maximum temperature found higher than the mean temperature from 1998 onwards except the year of 2007 (Figure 20). The yearly average minimum temperature showed irregular up-down variation with mean temperature for 20 years period.
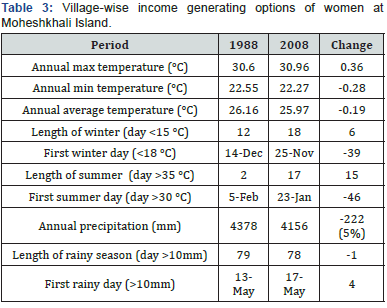
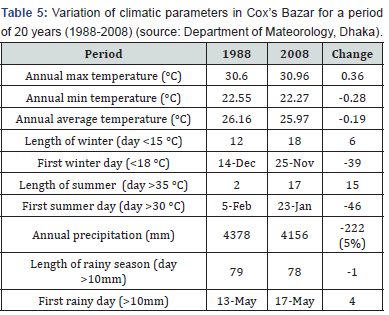
However, it seems that there is a slight warming trend of mean maximum and minimum temperature especially in the hottest month. In 20 years (1988-2008) variation, annual maximum temperature increased 0.36 °C, where annual minimum temperature decreased 0.28 °C and annual average temperature decreased 0.19 °C. Length of winter with temperature less than 15 °C has recorded 12 days and 18 days in 1988 and 2008 respectively, where first winter day shifted from 14 December to 25 November. Similarly, length of summer with temperature more than 35 °C has recorded 2 and 17 days in 1988 and 2008 respectively., where first summer day shifted from 5 February to 23 February (Table 5).
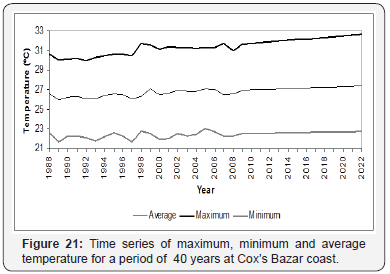
The predicted maximum, minimum and average temperature for a period of 40 years (1988-2022) showed increasing trend at Cox’s Bazar coast (Figure 21). Line graph showed that maximum temperature has a significant increase where minimum and average has a linear increase for the reported years. The maximum, minimum and average temperature were recorded 30.60, 22.60 and 26.60 °C for the year of 1988, where the predicted temperature were 32.63, 22.74 and 27.39 °C for the year of 2022.
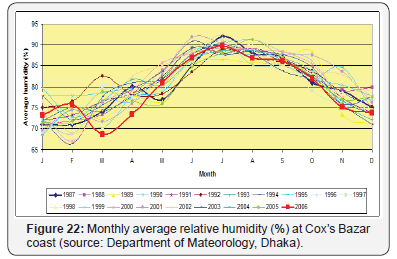
Humidity: Humidity is the amount of water vapor in the air, plays an important role in monitoring climate conditions, in the development of future weather forecasts and climate control along with temperature. Water vapour and its transport around the atmosphere is a fundamental component of the hydrological cycle and affects the earth’s energy budget in four main ways by storing energy in the form of latent heat, long-wave radiation effects serving as a source for clouds and finally, the amount of moisture in the air (Willet 2007). Water vapor is a lighter gas than air at the same temperature, so humid air will tend to rise by natural convection. This is a mechanism behind thunderstorms and other weather phenomena. Relative humidity is often mentioned in weather forecasts and reports, as it is an indicator of the likelihood of precipitation, dew, or fog. The highest humidity (80-90%) found during May to October in two decades duration at Cox’s Bazar coast (Figure 22). Considering the values of 1987 and 2006, the humidity showed decreasing trends.
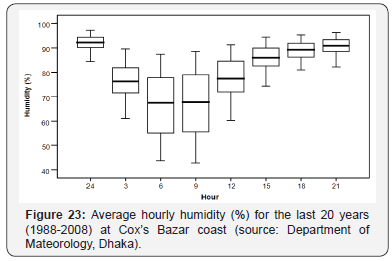
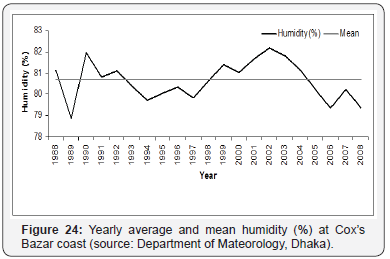
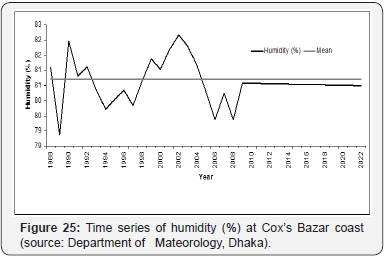
Higher humidity (> 80%) recorded during 1500 to 2400 hours where lower humidity (<80%) during 300 to 1200 hours at Cox’s Bazar coast (Figure 23). The lowest humidity found at 6 and 9 am. The «whiskers» are lines that extend from the box to the highest and lowest values. Yearly average humidity showed irregular fluctuation (78.85-82.15 %) with mean 80.71% for the last 20 years (1988-2008). Humidity after 2005 onwards showed decreasing trends than the mean value (Figure 24) and time series analysis showed decreasing trend after 2010 (Figure 25).
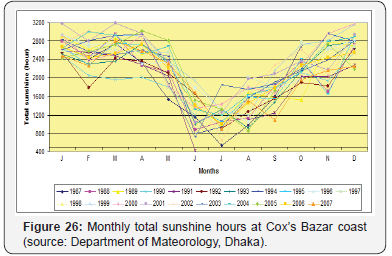
Sunshine: The sunniest months are January to April. The extreme most sunshine occurs in early summer. June and July are the dullest months. The minimum sunshine hours found during May to October (Figure 26) at Cox’s Bazar coast. Sunshine duration inversely related to precipitation.
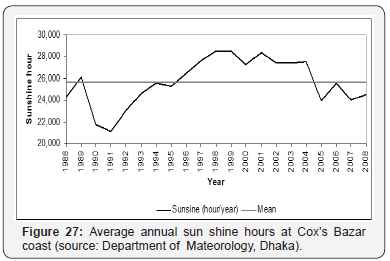
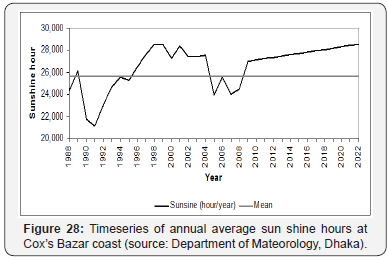
Average sunsine showed a decreasing trend from 1989 to 1991 and then a increasing trend up to 2004. Subsequent years has a decrease trend from mean value (Figure 27). The predicted sun shine hours through time series analysis for 40 years (1988- 2022) showed increasing trends at Cox’s Bazar coast (Figure 28).
Disaster mitigation strategies: Disasters take many forms and occur as a result of one or more wide ranging events, mostly caused by human errors. It has been fashionable to label most of the disasters as natural or man made; cyclone, floods, earthquakes, volcanic eruptions and drought are classified as natural disasters, while industrial accidents, land use changes, agricultural contaminations are called man-made disasters. On a very close examination, one would agree with the conclusion that every disaster is man-made. For instance, cyclonic storms of varying degree occur during pre-monsoon and post-monsoon seasons almost every year. It becomes a disaster only in those areas where human activities are heavily concentrated. If only there were no human settlements on the coastal areas close to the sea, it would be only a cyclone and not a cyclone disaster. Rapid increase in agricultural activities tends to reduce the capacity of the soil to retain and control the flow of water which results in floods. Indiscriminate felling of trees leads to low rainfall, and cause drought, which is man-made.
Disaster is a term used to describe the destructive effects or accidental damaging of human’s normal activities. These include, but not limited to, oil spills, atmospheric pollution, road accidents, and radiation accidents. Disasters are not new to human race but have become chief concerns as the damages caused by them are increasing continuously. With the experiences gained from management of disasters, the concern for containing the impact of disasters is growing. Although the ability of human beings to totally eradicate disasters is extremely low, scope for prevention and mitigation through proper planning is vast.
«Prevention IS better than cure», «a stitch in time will save nine» and similar sayings merely remain on paper and not practiced. Disaster prevention and preparedness planning have come to the fore only during the current decade yet, they remain limited only to the short-term measures which are taken during a warning period before the impact of a disaster event. Disaster prevention and preparedness should have a wide range of measures, having both long and short term perspectives designed to save lives and limit the extent of damages that might otherwise be caused by the event. Prevention has to be concerned with long-term policies and programmes to prevent or reduce the occurrence of disasters.
Response to disasters in coastal region has evolved over time. It was a humanitarian urge to offer help to disaster victims, but currently the response to the challenge of disasters has gone a step further - preparedness and to mitigation of the impact as well as containing their occurrence to sustain the efforts initiated to promote development. This calls for a strategy not only to mitigate disasters but also ensuring sustainable development.
The various initiatives and actions taken during the disasters by philanthropic people are still confined to offering humanitarian assistance. All these efforts put together constitute only a small portion of the massive relief operations undertaken in the event of disasters. The non-governmental voluntary organizations do make significant contribution to disasterprone areas and communities but they remain isolated and yet a major portion of the responsibility to manage disasters rest with government agencies.
Management strategy: The disaster management has been based on four major dimensions. These are:
a. Developing scientific methods for forecasting of disasters:
b. Timely response to disasters through relief operations;
c. Mobilizing the participation of affected community in undertaking rescue, relief, and rehabilitation activities; and
d. Contributing to resilience of societies and areas and quality of life
The need for building up society’s capabilities to meet the challenges of disasters has been articulated and recognized, but the thrust of relief efforts has so far been confined to alleviation and restoration aspects only in a country like Bangladesh where planned development is very much talked about, perspective action to continuously assess the vulnerability of disasterprone areas, preparedness planning and efforts to minimize their occurrence and impact still remain a theory articulated in seminars, conferences, and various other fora, but yet to be put into practice. In this background, one has to examine the various strategies and approaches to disaster mitigation.
Disaster reduction through development efforts: One of the major objectives of development programmes currently under implementation in Bangladesh is to improve the quality of life through a multi-pronged approach to development. Generation of employment in rural areas is receiving considerable attention through various programmes: enhancing the income of the poor families is attempted through poverty alleviation programmes, need for providing safe water for drinking in rural areas has drawn the attention of policy-makers; extending the area under irrigated agriculture has been the major trust in all the five-year plans. Without proper harmony of objectives and components, many of the programmes have failed to achieve the goals originally planned. The need to strengthen the symbiotic relationship between disaster reduction and sustainable development efforts has to be emphasized in development planning process.
Any society economically developed has a built-in strength to manage disasters on its own. The level of economic development has a direct bearing on the extent of damages and losses during disasters. The loss of property and human lives due to disasters are inversely proportional to the level of development which can be seen from the global picture. At the same time, the pressure on scarce resources, both physical and financial, exerted by competing development goals make disaster mitigation and preparedness more formidable in the developing countries than in the developed world.
Inter-disaster phase: The period between two consecutive disasters could be gainfully used to formulate plans to meet the challenges. The various activities that could be undertaken during this phase should include, among others, the following
a. Mapping of disaster-prone areas based on the degree of vulnerability;
b. Educating and training the community in the disasterprone areas,
c. Strengthening the infrastructural facilities that are utilized during the disasters impact period, such as relief shelters, stores to stock supplies, medical and health care centers; and
d. Promoting the voluntary groups to take up relief operations on partnership basis with government agencies
The inter-disaster phase is to be treated as the «Golden Phase» to prepare for meeting any impending disasters. Ministry of Disaster Management, as the nodal authority, formulates guidelines on relief policies, provides assistance to local government agencies, and co-ordinates at the national level ministry and organizations.The local government agencies have to formulate contingency plans at the district, sub-district and village levels to deal with different types of disasters, while formulating contingency plans, the local government have to assess the managerial and technical skills of the personnel at various levels required to execute the contingency plans This aspect has not received adequate attention, so much so relief agencies at the district level differ in the efficiency with which they manage the various operations during the disasters. For Instance, irrigation engineers posted to flood-prone areas without the required experience and skills to manage floods, medical personnel without necessary background and competence to handle rescue and relief operations are quite common. The strategy to mitigation of disasters should, therefore, ensure making available the necessary and sufficient management skills.
Training of disaster managers: Disaster management has not yet attained the status like that of personnel management or materials management as a discipline in management science; it is a multi-disciplinary function which requires engineering, medical, behavioural sciences to contribute to managing the situation that would be necessary during emergency. Emergencies are characterized by some distinguishing features, urgent need for quick decision making often under serious constraints like acute shortage of trained personnel, materials, and time to implement the decisions effectively. Even under normal circumstances, decision-making is a complicated and prolonged process. A well designed disaster plan should hence seek to identify the type of problems that would be confronted during disasters and enlist the possible decisions that could be taken. This should form part of the disaster mitigation plans. Further, it is also necessary to avoid any vacuum or ambiguity concerning which official, agency, or organization has the authority and responsibility to make crucial decisions during a disaster.
Safety norms through designs: Delineation of hazardous zones depending upon the extent of risks could be used as criteria for determining the required safety norms to be exercised in the disaster prone areas. Foster [14] refers to this as Microzonations. They have the potential to reduce disaster losses by the avoidance of sites that have unacceptably high risk characteristics. It is particularly important that the strategy for disaster mitigation is adopted to save lives and minimize damage to property. Losses and damages can be reduced by evolving ways and means to improve the design, maintenance and use of infrastructural facilities. The agencies responsible to coordinate and ensure safety have to monitor changes in a wide variety of situations and evaluate their impact on risk. Such a concern for safety is not new.
The reduction of life loss through proper and adequate design and construction of structures have been the chief concern of policy makers, planners, architects, and engineers. As early as 1750 B.C., codes for building structures had existed in Babylonia [14]. According to the law that existed, the builders shall be punished and sentenced to death if the building collapsed causing death of the owner. In case the house collapse leads to damage to property, the builder shall be responsible for reconstructing the building at his expense. However, currently the penalty has been reduced; safeguards given to the owners have become less comprehensive, thus becoming a major concern of the construction industry. In the earthquake-prone areas, ensuring safety norms in the design have to be strictly enforced as a strategy to reduce the impact of earthquakes.
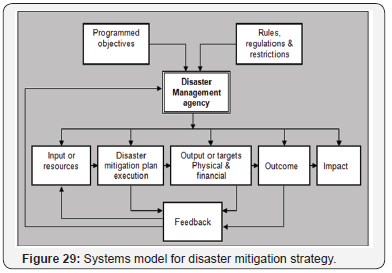
Disaster preparedness planning - a systems approach: The development and disaster reduction plans formulated have been based on laudable goals and objectives. While implementing the plans, the bureaucrats have shown considerable interest and concern for achieving the targets, both financial and physical. However, the need for ensuring quality of services rendered and generating the expected impact have been a factor often ignored. The objectives of the development plans seem to have been not understood as spelt out in the plan documents. As mentioned earlier, the programmes which are expected to be «integrated» development programmes have turned out to be assorted ones. This is largely due to the absence of systems approach to planning for development. It is in this context, a model for development is presented below with the various elements of the system, each one characterizing the different components in the development planning process [15-18].
a. Programmes objectives
Any development plan formulated hitherto has an objective or a set of objectives to be achieved. In public systems development, plans and programmes have more than one objective to be realized. However, objectives also get stated in dubious words not clear about what should be the level or development to be achieved.
b. Management control
In the development planning and management process, the management control is a very crucial element which would determine the effectiveness of the plan implementation. It is the organization created to plan and mange the tasks assigned. While the government agencies play the major role in managing disasters, the support from the non-governmental/voluntary agencies cannot be undermined. The organization structure needs to include the voluntary agencies for disaster management [19-23].
c. Inputs/resources
Any type of disaster would require inputs or resources to undertake the various relief tasks. The Inputs would include among others, material, manpower, finance, supplies, equipments, etc. The role of the management control is to determine in advance the type of inputs that are to be made available, their quality and quantity, the place from where to be mobilized, and what point of time they have to be made available.
d. Plan execution
The disaster management plan execution would convert the inputs into a set of results; the first result is the output, which is otherwise termed as the target. In the disaster management plan, the output would include, among others, the number of families evacuated, the number of drinking water sources disinfected, the number of breaches arrested and the like.
e. Outcome
The outcome of the disaster management plan implementation is the result of output generated or target achieved. These include the number of lives saved, the number of families given compensation in cash and kind or given exgratia payment, and the like. The strategy for disaster mitigation should indicate the outcome of the efforts put in by the agencies in the affected areas. The disaster management plan should aim at achieving the goal of restoring the normal life in the affected areas at the earliest.
f. Feedback
Every plan has to have a built-in feedback mechanism. The term feed-back has to be seen in two different connotations:
I. To evaluate the disaster management plan while in its execution phase using the communication channel that would be in use; and
II. As a plough-back mechanism by which the results generated could be recycled to support similar efforts in future or elsewhere
The above listed elements of the system are inherently present in disaster reduction/development efforts and they are interrelated elements as shown in Figure 29, obeying the definition of a system. This model helps understand the planning and management process in its totality and makes the disaster management personnel see beyond the targets they have to achieve.
Conclusion and Recommendation
1. Construct coastal embankment in the exposed zone to prevent saline water intrusion
2. Develop coastal green belt through mangrove afforestation in the accreted and exposed zone
3. Formation of community based social volunteer organizations to aware, train, educate and demonstrate the islanders on adaptation practices during and after the disaster events
4. Renovate the existing fish landing center with modern scientific facilities and construct more fish landing centers in the island
5. Develop communication network to reach weather forecasting and danger signals to the fishing boats during operation in the Bay of Bengal
6. Make availability of life jackets in the fishing boats for all crew, fisher and helper
7. Arrangement of solar panel to develop continuous electricity supply in residence, market, ice mill and other important places
8. Improvement of road network and communication facilities
9. Arrange safe drinking water for the island dwellers
10. Ensure health facility for the islanders with medical centers, doctors and medicine
11. Empowering women through awareness, training and education to participate in family decision making and job opportunity for income generation
12. Renovating existing schools and construct new schools with teaching and learning facilities
13. Renovating the existing cyclone shelters and construct new shelters to accommodate the islanders during climate change disaster events
14. Discourage the ever practicing early marriage and multi-marriage traditions among the islanders including dowry system
15. Scientific investigation to assess the stock of fisheries with fishing efforts (crafts, gears and fishers) and to develop prediction for the coming years
16. Conservation of indigenous aquatic biodiversity of the island
17. Enhancing feeding, breeding and nursery grounds of indigenous fisheries through conserving mangrove ecosystem of the island
18. Create saving tendency among the islanders with proper utilization of their assets hand, this technology, which competed with the artisanal craft and gear for the same species and space, deprived traditional fishermen of their regular catches. Bulk landings at the centers of purse seining reduced the fish prices as well [2]. Under the circumstances, the need of the hour is
I. Proper assessment of the inshore resources and fix an optimum number of craft gear combinations of nonmotorized and motorized country craft, mechanized gill netters and a limited number of trawling boats to be carried out as a priority program at the national level.
II. Reserve coastal waters up to a depth of 10 fathoms for the exclusive use of the artisanal units.
III. Completely ban night trawling and stipulate a quota system of catches for each trawling boat.
IV. Prohibit purse seining in the inshore waters.
V. Provide Research and development support to the smallscale fisheries.
VI. Control destructive fishing such as the use of the smallsize mesh.
VII. Develop a consciousness among the workers regarding the nature of resources and the need for management.
VIII. Prevent indiscriminate dumping of toxic materials, industrial effluents and sewage through greater penal action against offenders.
IX. Encourage national awareness of the need for preserving the environment. It is laudable that a national awareness campaign has been launched throughout the country, but we have a long way to go before we can achieve our goal.
Apart from the above, other current key management problems in Indian fisheries include: Inadequate fisheries regulations are lack of implementation/enforcement, lack of transparency and trace ability, failure to follow scientific advice, Flag of Convenience vessels, too few no-go areas for fishing
To Know More About Open Access Journals Publishers Please Click on: Juniper Publishers
Comments
Post a Comment