A Review of New Understanding of the Role of Individual Structure within the Head of Dolphins in Formation of Biosonar Signal and Beam-Juniper Publishers
Juniper Publishers- Journal of Oceanography
Abstract
New data obtained in the past five years have significantly increased our understanding of sound propagation within the heads of dolphins. Results of Au et al. [1] reinforce the notion that source intensity is the primary factor controlling the peak and center frequencies of biosonar clicks which in turn affect the duration and the bandwidth of clicks. Finite element simulation in the vertical plane of broadband acoustic signals propagation in the head of the Baiji or Lipotes vexillifer [2] and ongoing simulation with Phocoena phocoena and Tursiops truncatushave shown that the air sacs and skull are the major contributor on the shape of the beam and that the melon has a minimum role in the focusing of the signals. The small acoustic impedance gradient in the melon does not allow sufficient ray bending to take place even if the melon is deformed slightly. Comparing the biosonar signals used by free-swimming and stationary dolphins in a pen showed a similar tendency of dolphins, like bats, to emit longer duration signals with greater bandwidth while free swimming. The wide off-angle measurements of the biosonar beam of Tursiop truncautus revealed an internal reflection as the cause of a 2nd pulse in the signals.
Introduction
In recent years a number of experiments and measurements associated mainly with the Atlantic bottlenose dolphin (Tursiops truncatus) and one with the harbor porpoise (Phocoena phocoena) have shed some interesting light on biosonar signal production and propagation in the head of the animals and the formation of the biosonar beam. In this short review, the results of these experiments will be taken together to increase our understanding of the subject and shed new light on the processes involved [1-4].
The various topics will be discussed in this paper:
- The connection between how biosonar signals are produced and the role of intensity on the frequency content and other parameters of clicks. A conceptual model of how the phonic lips produce biosonar signals will be used to explain the connection between intensity and the frequency characteristic of the signals. A comparison between biosonar signals emitted by two free swimming dolphins searching for mine-like targets on the bottom of San Diego Bay and a single dolphin performing an in-pen target discrimination task also in San Diego Bay is made.
- The role of three structures in the head of a dolphin, the skull, air-sacs and melon in the formation of the biosonar beam.
- The presence of two-component biosonar signals measured at extreme off-angle (angles away from the beam axis) and the role of the phonic lips in producing these two- component biosonar signals.
- The emission of biosonar signals from the right phonic lips during biosonar experiments with 4 species of odontocetes and the emission of whistle from the left phonic lips of two species of dolphins.
Conceptual model of biosonar signal production
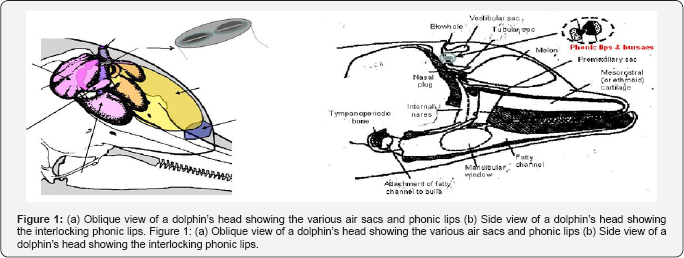
The head of a dolphin shown in Figure 1 is a very complex structure with unique air sacs and special sound-conducting fats. One of the most perplexing issues that have eluded researchers since the discovery of echolocation has been the location and mechanism of sound production in dolphins. In the mid-1980s, Ted Cranford began using modern X-ray computer tomography (CT) and magnetic resonance imaging techniques to study the internal structure within a dolphin's head [5]. These noninvasive techniques allowed Cranford to study the relative position, shape, and density of various structures in the dolphin's head and leading him to conclude that the monkey lip-dorsal bursae (MLDB) region of the dolphin nasal complex was the location of the sound generator. Eventually, Cranford et al. [6] were able to obtain high-speed video in 1997 of the phonic lips (previously referred to as the monkey lips) with simultaneous hydrophone observations of echolocation signals. There are two sets of phonic lips, associated with the two nares in the dolphin's nasal complex. Cranford and colleagues have obtained highspeed video observation of movements in both sets of phonic lips during the production of echolocation signals and whistles surrounding the phonic lips.


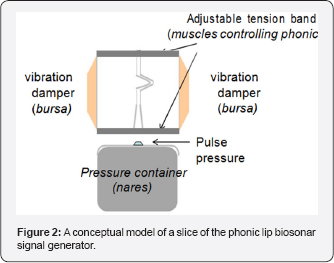
The phonic lips are controlled by a number of strong muscles. A conceptual model of a phonic lip is shown in Figure 2 and will be used to explain how biosonar signals are produced Muscles force the lips to close tightly and interlock to form a strong seal separating the air in the nares from the other side of the lips. When the pressure from a puff of air is strong enough to break the seal, the lips will open momentarily as the puff of air shoot through the opening. The phonic lips will slam shut immediately after the passage of air through the opening causing the structure to vibrate in such a way that an initial loud impulsive sound and subsequent damped oscillation are produced. The force of the two lips slamming against each other will be proportional to the force closing the lips, which determines the amount of air pressure needed to break the seal formed by the closed lips. The frequency of the acoustic vibration is controlled by the tension of the muscles controlling the closure of the lips. A tighter the seal will lead to higher the tension on the structure causing the structure to vibrate at higher frequency. The muscles controlling the lips will also force the lips together to damp the vibration of the lips. The dorsal bursae can also act as dampers to further reduce the vibration so that the emitted acoustic signal will resemble an impulse followed by a damped oscillation. Therefore, the frequency of vibration will be directly related to the intensity of the acoustic signal generated.
The effects of intensity
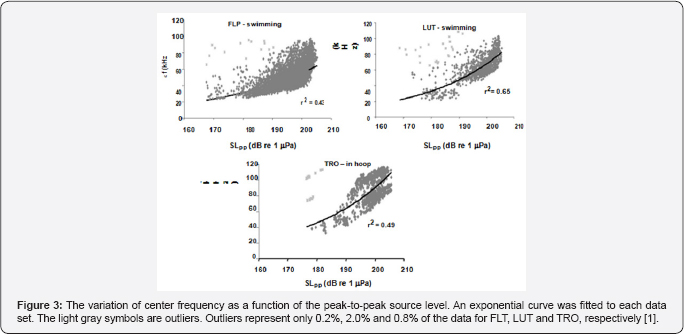
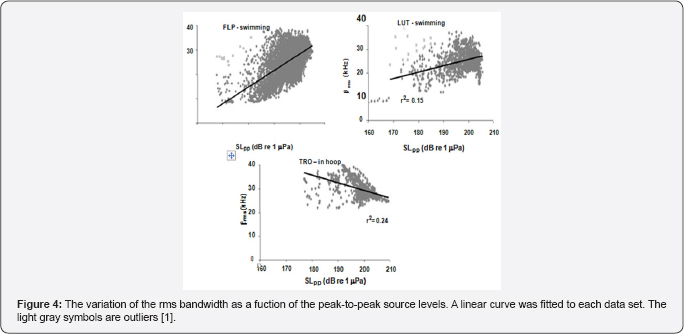
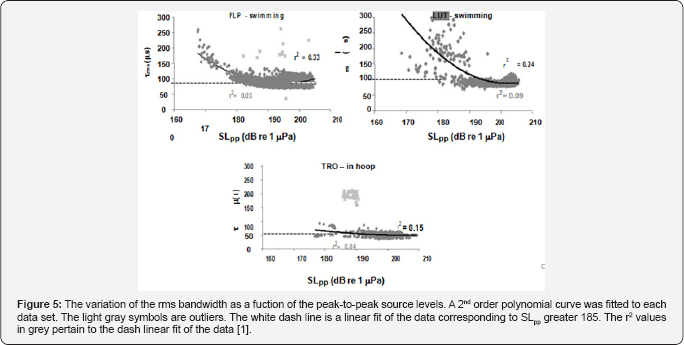
The variation of center frequency with peak-to-peak source level is shown in Figure 3 for three dolphins, two were free swimming bottlenose dolphins (LPT and LUT) hunting for bottom mine-like targets in San Diego Bay and the third was for a dolphin (TRO) performing an in-pen experiment in San Diego Bay [1]. The free-swimming dolphins were carrying a special device so that the center frequency increased as the source level increased for all three dolphins in a similar to the data generated by a false killer whale (Pseudorca crassidens) reported by Au et al. the Atlantic spotted dolphin the Atlantic bottlenose dolphin [7] and Indo-Pacific Bottlenose dolphin and for another Atlantic bottlenose dolphin name TRO. In the experiment of TRO [8] emitted higher amplitude pulses between 190 and 218dB whereas in the Au et al. [3] experiment TRO emitted clicks with source levels between 178 and 206dB approximately 12dB lower. This will have a slight effect on the rate of change in center frequency with source level. Individual differences in the rate at which center frequency changes with source level can be seen in the results of the free swimming dolphins. The center frequency of all three dolphins in Figure 3 increased with source level but at slightly different rates Au et al. [1] also reported on how the rms bandwidth and rms duration varied with source level. The relationship between rms bandwidth and peal-to-peak source level is shown in Figure 4 for the three dolphins. The rms bandwidth increased with source level for the free swimming dolphins FLP and LUT, while the rms bandwidth decreased as the source level increased for the stationary dolphin TRO in a hoop station. The results for TRO were consistent with the results in of the measurements on the same animal conducted by Finneran et al. [8] the results of Figure 4 suggest that a difference in the trend of bandwidth between the free swimming dolphins and the stationary dolphin in similar to the data generated by bat signals measured by Surlykke and Moss (2000).


The variation of the rms duration of the biosonar clicks with peak-to-peak source level is shown in Figure 5 for the three dolphins. Overall, the rate of change in the rms duration was much steeper for the free-swimming dolphins than for stationary one, with LUT having the largest change. However, if only signals with source levels greater than 185dB are considered, the linear fit was not significant different from zero. The slope for FLP was 0.3860 (t=12.971, p<0.001), -0.7498 (t=-9.907, p<0.001) for LUT and -0.34111 (t=-6.241, p<0.001) for TRO. It is interesting to note that the data for both LUT and TRO had negative slopes whereas Flip had a positive slope. The mean and standard deviation of the rms duration for source levels greater than 185dB was 88±1|is for FLP, 90±12|is for LUT and was 51±7|is for TRO. The rms duration for the free-swimming dolphins were not significantly different from each other but were significantly different than that of the stationary dolphin. The rms duration for the free-swimming dolphins was at least 1.7 time greater than for the stationary dolphin.

The role of structures in the dolphin's head in the formation of the biosonar beam

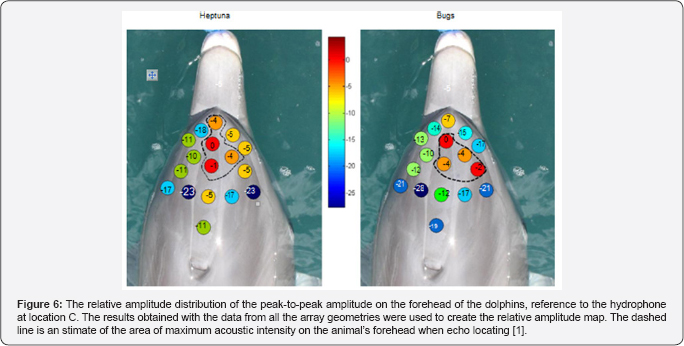
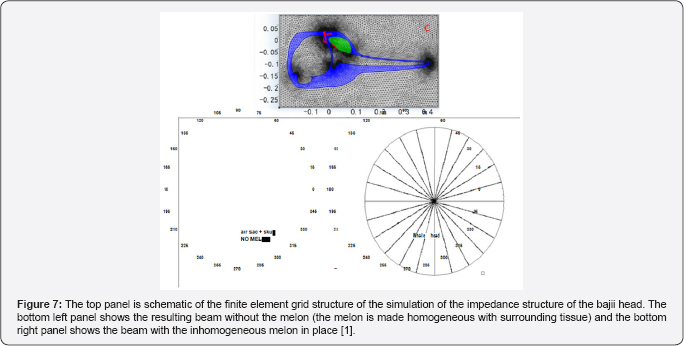
Au et al. [9] used suction cup hydrophones to measure the relative peak-to peak PL on the head of echolocating dolphins and to determine where on the head does the biosonar beam exit. Their results are shown in Figure 6 for two dolphins. The dashed line in each panel indicates the area the SPL were largest and the red spot with the number "0" marked the approximate location of the beam axis. Note that the SPL at towards the blowhole is already many dB below the signal at the beam axis, strongly suggesting that a beam is already formed before the signal reaches the melon of the dolphin which also suggests that the role of the melon in focusing the outgoing signal is very min. The finite element numerical simulation of a broadband signal propagating through the head of a bajii was performed by and the results are shown in Figure 7. They computed the beam for cases in which one of three structures (skull, air sacs, melon) were systematically removed to determine the overall effect of the removed structure on the beam. The results confirmed [9] assertion that "it is clear however that the effects of the and air sacs dominate" and that the melon "by itself could not produce the dolphin's highly directed acoustic beam."

Multi-Component Biosonar Signals- Wide off Axis Signals

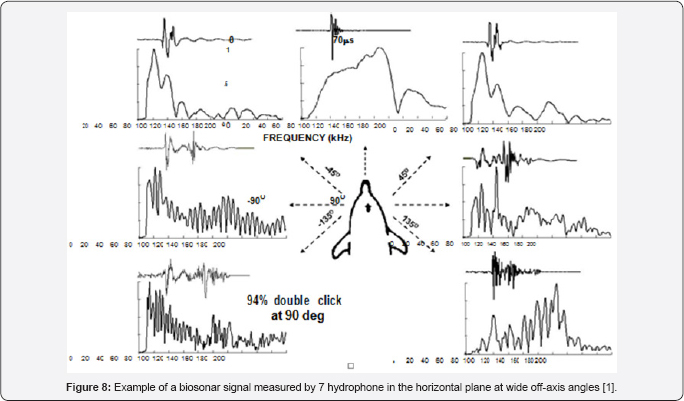
Lammers and Castellote [10] used two hydrophones, one on the acoustic axis and another at the off-axis angles to measure the biosonar signal of a beluga. When the off-axis was greater than 45° the signal consisted of two clicks of similar amplitudes but separated in time depending on the position of the offaxis hydrophone. They hypothesized that the two- component biosignal were generated by the two phonic lips. With only two hydrophones that was the most reasonable assumption. Au et al. [3.4] used hydrophones to measure the biosonars at wide offaxis angle emitted by a Tursiop truncates and also found that the biosonar signals consisted of two clicks at angles greater than 45° an example of a single click measured by the 7 hydrophones are shown in Figure 8. The on-axis signal is clearly a single click and as the off-axis angle increased to ±45° the signals began a transition into a two click signal.
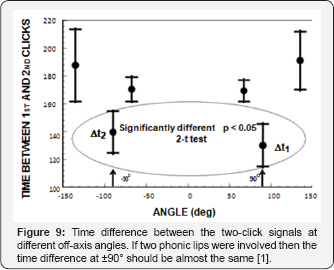
In order to test the hypothesis that two phonic lips were involved in the generation of the two component signals at large off axis angles, Au et al. [4] examined the inter click interval difference between the signals measured at ±90°. If the two phonic lips were involved in the producing the double click signal then the time difference between the first and second clicks should be approximately the same as ±90° because of symmetry. These results strongly suggest that the 2nd component of the two-click signal was not being directly generated by a second phonic lip but was the result of a reflection of the skull.
Role of two phonic lips
The question of how the two phonic lips (Figure 1a) function in the biosonar process will now be examined. Cranford et al. [11] were one of the strongest proponents of the idea that the two pairs of phonic operating almost simultaneously could generate two pulses that interfere to form a single click with a higher power output and broader bandwidth. While Au et al. [3.4] were studying clicks at wide off-axis angles, Madsen et al. [12] using suction cup hydrophones found that Phocoena phocena emitted biosonar signals only from the right phonic lips generating a lively controversy with Cranford [13] (Figure 9).

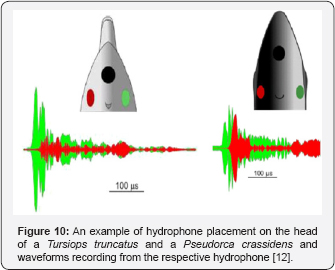
Finally, the Danish team along with Lammers of HIMB used data from suction cup hydrophones on a Pseudorca and four Tursiops along with previously collected data on Phocoena to show that the biosonar clicks were indeed produced by the right phonic lips and whistles by the left, essentially putting the controversy to rest [12]. As example of how hydrophones embedded in suction cups were used to in the study is shown in Figure 10 for two species of dolphins. The green hydrophone was placed on the right side on the animal head's and the red hydrophone was placed on left. The results clearly Figure 10. An example of hydrophone placement on the head of a Tursiops truncatus and a Pseudorca crassidens (from and waveforms recording from the respective hydrophone showed that biosonar clicks were emitted by the right phonic lip of one false killer whale (Pseudoca crassidens) and five Tursiops truncatus. Whistles were emitted by the left phonic lips by the two dolphin species. Phocoena phocoena do not whistle which leads to the question as to the role of the left phonic lips. However, Phocoena phocoena do emit communication signals with high repetition rate which consist of biosonar-like clicks with adjustable repetition rate Amudin [14]. Measure communication clicks emitted at a rate as high as 1250 clicks per second which would consist of the lower end of the frequency spectrum of whistles used by many dolphins.

Conclusion
A number of important experiments and finite element simulations conducted in the past five or so years coupled with some older experimental results have substantially increase our understanding of biosonar signal propagation within the heads and the formation of the outgoing beam of odontocetes [15].
A summary of our current state of knowledge on signal production and propagation in the head and production of biosonar beam can be summarized as follows:
- Intensity plays a dominate role in the determining the overall characteristics of the emitted signal.
- The signals used by free swimming dolphins may be slightly different than captive dolphins involved in relatively static and repeatable experiments.
- The directional characteristics of the dolphin biosonar beam are influenced mainly by the skull and air-sacs. The melon does affect the shape of the beam but minimally and its major role is as a waveguide and an acoustic impedance transformer. To attribute the melon as an acoustic lens with a very high focus property would be ignore the physics of refraction and reflection of acoustic signals.
- Multiple component biosonar signals are produced by one phonic lip and include a reflection off the skull. The exact spot in which the reflection occurs is not known. All experimental data have implicate the right phonic lip as the click production site and the left phonic lip as the whistle or communication production site
Even as much progress have been made in recent years to understand click production and propagation within the head of dolphins and the formation of the outgoing beam, much more research needs to be conducted to explore the more intricate and subtle processing occurring within the head. For example, recent high-speed video measurements have shown that the melon of the harbor porpoise flattens as the animal approaches within a meter of a prey. How the physics affect sound propagation through such a melon needs to be investigated. As with all research, more specific questions are being generated as we gain deeper understanding [16,17].
To Know More About Journal of Oceanography Journal Please Click on: https://juniperpublishers.com/ofoaj/index.php
To Know More About Open Access Journals Publishers Please Click on: Juniper Publishers
Comments
Post a Comment