Valuation of Nutrient Utilization, Protein Requirement and Proximate Assessment of an Ecotype Tilapine ‘Wesafu’ Fingerlings Reared in Earthen Pond
Oceanography & Fisheries Open Access Journal Juniper Publishers
Authored by: Albert O Amosu
Abstract
This study was conducted to evaluate the nutrient utilization, protein requirement and proximate analysis of Wesafu from fry to fingerlings in an earthen pond. The experimental fish were monitored for comparative analysis and growth performance using commercial feed (Coppens® 0.2mm) and wheat flour in formulating feed with 30%, 35%, 40% and 45% crude protein levels. Fry were fed thrice daily at 8am, 12 pm and 4pm with 5% body weight for 8 weeks. Samples of experimental diet and fingerlings were analyzed for proximate composition while growth performance and nutrient utilization of diet were evaluated using growth indices such as Weight Gain (WG), Percentage Weight Gain (%WG), Specific Growth Rate (SGR), Food Conversion Ratio (FCR), Gross Feed Conversion Efficiency (GFCE), Protein Intake (PI), Protein Efficiency Ratio (PER). The results revealed that the highest cumulative weight gain (10.58 ± 0.12) was recorded in fry fed 45% crude protein diet while the lowest (6.58 ± 0.21) was observed in the 30% crude protein diet .There were no significant differences (p>0.05) in specific growth rate, food intake, food conversion ratio, gross food conversion efficiency and protein efficiency ratio while there were significant differences (DNMRT; ANOVA; df = (n-1); p < 0.05) in weight gain, protein intake. This study indicated that a diet containing 45% crude protein appear to be suitable for rearing Wesafu fry to fingerlings in earthen ponds.
Keywords: Aquaculture; Cichlids; Diet; Ecotype; Fingerlings; Growth; Nutrient; Wesafu
Abbreviations: WG: Weight Gain; FCR: Food Conversion Ratio; GFCE: Gross Feed Conversion Efficiency; PI: Protein Intake; PER: Protein Efficiency Ratio; SGR: Specific Growth Rate; LSD: Least Significance Difference; DNMRT: Duncan’s New Multiple Range Test; SE: Standard Error
Introduction
As the global population continues to rise, the need for sustainable alternative sources of protein also increases [1]. Research estimated that the worldwide requirement for food will increase up to 50 % by 2030 [2]. Juxtaposing the production input efficiencies of aquaculture versus several of fisheries and terrestrial agriculture systems shows that aquaculture is among the world’s most efficient mass producer of protein [3]. Protein is the most important constituents of fish and also the most expensive constituent of fish feed and global expenditure exceeds (7.05 million MT) €1bn per annum [4,5]. Aquaculture production is growing at a rate of nearly 9% per annum [3,6]. As wild fish stocks decline, the aquaculture industry faces a massive challenge to identify cost-effective and environmentally friendly alternatives to fish production on which it is so heavily reliant [1,7]. Cichlid aquaculture has the potential to provide a solution to this problem as it is relatively underexploited in Nigeria and can be cultured in a sustainable manner [8]. Cichlids are one of the most diverse fish species and widely cultivated fish families in the world, though their natural distribution was confined to North America, Central America, South America, Africa and the Mid East [9]. The family has been introduced into various continents including Australia [10]. Wesafu is an indigenous ecotype cichlid, very important specie of the fisheries of Lagos coastal waters in Nigeria [11-12]. The diversity of an unidentified cichlid of great abundant in Epe Lagoon commonly referred to as Wesafu and the large size cum weight it attains in the wild influence the drive for possible domestication, culture and exact identification and naming of this specie [13-14]. Several research studies have been conducted on this indigenous specie such as Age and growth, Aquaculture system, Characterization, food and feeding habits, nutrition, meristic and morphometric characters among others [11-22].
Tilapines are Cichlids with fast growth, resistant to diseases and handling, easy to reproduce and are able to tolerate a wide range of environmental conditions. They are widely cultured in tropical and subtropical regions of the world and constitute the third largest group of farmed fin fish with an annual growth of about 11.5% [3,23-25]. Proper feeding management is therefore a necessary tool for successful tilapia culture. Nutrition and feeding play important role in sustainable cichlid aquaculture therefore, feed resources as well as costs continue to dominate aquaculture needs. Feed accounts for 40-60% of the total production costs in aquaculture, with protein sources accounting for a significant proportion of this cost [1,3,22-24]. Frys and fingerlings require diets higher in protein, lipids, vitamins, minerals and lower in carbohydrate as they are developing muscles, internal organs and bones with rapid growth. Adult fish needs more calories of fats and carbohydrate for basal metabolism and a smaller percent of protein for growth [19]. The energy needs of the fish can be met by less expensive lipid and carbohydrate sources. The protein requirement of tilapia was estimated to be from 25% to 45% of diet [26,29-34]. Under natural condition, Tilapia is predominantly an herbivore and a detritus feeder. This means that they can provide high quality protein, suitable for human consumption from less protein sources [35]. Inabilities to develop suitable commercial and improved strain of tilapias that will grow to table size in good time are few of the problems militating against a viable tilapia industry in Nigeria [14]. The problem of precocious sexual maturity and unwanted reproduction has long been accepted as a major constraint to further development and expansion of tilapia culture in Nigeria. In addition, unwanted reproduction which leads to excessive recruitment (overpopulation), particularly in ponds, resulting in competition for available food and space resources as well as the ease of reproduction represents the principal problem in the optimization of yield in tilapia culture. Therefore, this research was geared towards determining the growth performance, dietary protein requirement and nutrient utilization of this economic important ecotype cichlid. The increased intensification of culture method for warm water fish such as tilapia has necessitated the provision of balance ration to satisfy the dietary requirement. Despite the commercial values of Wesafu, a tilapia highly priced fish in Lagos, Nigeria due to its tasty flesh and large size of over 1500g in the wild, little information exists on its nutritional requirements, in cultural practices yet it has culture potential in the country.
Materials and Methods
Experimental fish
One thousand four hundred and forty (1440) fry of average weight of 0.93 ± 0.16 were used in determining the protein requirement of Wesafu. The fish was raised from fry to fingerlings stage at Seg farm a private aquaculture farm in Topo village (6°25’0’’ N; 2°55’59’’ E) (Figure 1) on the West Coast of Badagry, Lagos, Nigeria. Fry were weighed and stocked in hapas. Prior to feeding trials, the experimental fish were starved for a day (24h) to ensure that their guts were emptied.
Experimental Design
Twelve (12) hapas (1 × 2 ×1.5m) were placed in earthen pond were used which was conducted in four stages:
a) Fry fed with 30% crude protein represent A in triplicate
b) Fry fed with 35%crude protein represent B in triplicate
c) Fry fed with 40% crude protein represent C in triplicate
d) Fry fed with 45% crude protein represent D in triplicate The fish were divided into one hundred and twenty (120) fry, stocked per in twelve different hapas in three replicates of 30%, 35%, 40% and 45% crude protein level and fed at 5% body weight. The 5 % the daily ratio was divided into 3 equal parts and fed at 8a.m, the second portion at 12p.m and the third portion at 4p.m. Each unit of experiment lasted for 8 weeks. Coppen 0.2mm feed was used with a protein content of 56% (Manufactured by Alltech Coppens Aqua Center, Germany) and wheat flour of 12% to formulate the diets using Pearson square method. All these hapas were placed in earthen pond in the farm and were covered with net to prevent the fish from escaping.
Determination of growth performance and nutrient utilization
Weight gain (wg)
The weight gain by fish was calculated from the differences between the final mean and the initial mean weight that is the final mean weight of fish at week eight subtracted from the initial mean weight of fish at week zero [36].
Weight gain (WG) = final weight (W2) – initial weight (W1) WG = (W2) – (W1)
Where:
W2 = Final mean body weight (g)
W1 = Initial mean body weight (g)
Percentage Weight Gain (%WG)
The percentage weight gain was calculated from the formula according to [14].
% weight gain = (X2 ) – (X1)×100 / (X1)
where:
X2 = Final mean body weight (g)
X1 = Initial mean body weight (g)
Specific Growth Rate (SGR)
Specific growth rate was calculated according to [36] as
SGR = Loge W2 – Loge W1 / T2 – T1
where:
W2 = Weight of fish at time T2 in days
W1 = Weight of fish at time T1 in days
Loge = Natural log of base e
Food Conversion Ratio (FCR)
Food conversion ratio according to[36] as FCR, expressed as the proportion of dry food fed per unit live weight gain of fish:
FCR =Weight of dry fed (g) / Live weight gain (g)
Gross Food Conversion Efficiency (GFCE)
The gross food conversion efficiency was calculated according to [36] as the percentage of the reciprocal of feed conversion ratio.
gFCR = 1×100 / FCR
Protein Intake (PI ) = Total feed intake × % protein in the diet Protein Efficiency Ratio (PER) = weight gain / Protein intake
Nutrient Evaluation of Experimental feed and fish
Samples of experimental feeds and fish were analyzed for their proximate composition according to the methods of [37].
Moisture content
The moisture content of the different fry samples were determined
% Moisture content = M1 − M2 / M1 − M0 × 100
where
M0 = Weight in g of fish and lid
M1 = Weight of g of dish, lid and sample before drying
M2 = Weight in g of dish, lid and sample after drying
M1 − M0 =Weight of sample prepared for drying
% dry matter content = 100 − % moisture content
Crude protein
Determination of crude protein was done using total kjeldahl nitrogen method.
% Nitrogen = 0.0075× A / B ×C
where
A = Mg /L reading displayed
B = g – sample digested
C = ML digest analysed
Determination of crude fat or lipid
The measure fat content of all the soluble materials present was determined according to [38].
% Fat = W3 –W2 /W1
where
W3= Weight of the cup with the extracted oil.
W2 =Weight of the empty cup
W1 =Weight of the sample.
Determination of the total ash
The percent of ash was calculated as follows:
Percentage (%) of ash = (weight of ash / weight of sample)×100 % Ash = (W2 /W1)×100
where,
W1 = Weight of sample (g)
W2 = Weight of ash (g)
Determination of crude fibre
The amount of the crude fibre content in the sample was determined using the acid/base digestion process [39].
% Crude fiber =Weight A −Weight B / Sample Weight
Where
Weight A = Weight of crucible + dried residue
Weight B = weight of Crucible + residue ashed
Statistical Analysis
All data collected were presented as mean values of each determination ± standard error (SE). Analysis of variance was performed using one way ANOVA procedure. Differences between the mean values of the treatments were determined by the least significance difference (LSD) test and the Duncan’s New Multiple Range Test (DNMRT). The significance was defined at p < 0.05.
Results
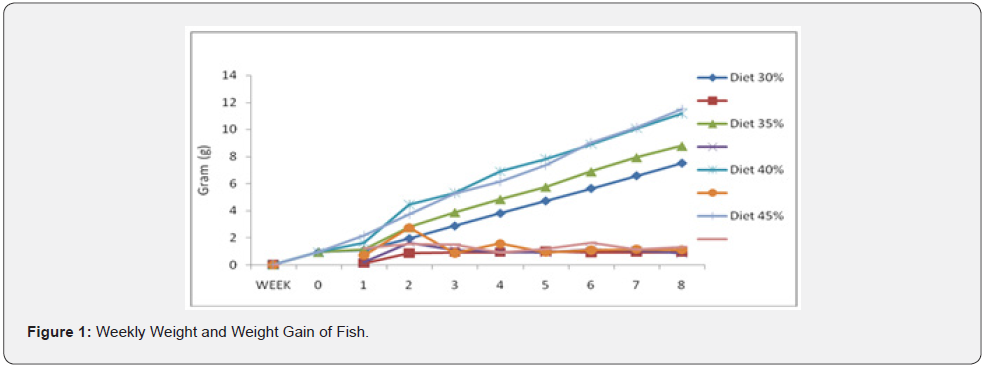
The result of the experiment shows that there was increase in the weekly growth rate, weekly feed intake, and food conversion ratio, protein intake while there was decrease in the weekly Specific Growth Rate, Gross Food Conversion Efficiency and the Protein Efficiency Ratio. It was observed that the weekly feed intake consumed increased per week in the following sequence Diet 1 > Diet 2 > Diet 3 > Diet 4 (Table 1). The weekly mean of total feed consumed showed a progressive increase throughout the experiment and there was significance (p<0.05) difference throughout the experiment. The weekly mean weight in Figure 1 shows increase trend from week one to week eight and there was significance difference (p< 0.05) between the crude protein levels throughout the experiment.

The weekly mean of total feed consumed showed a progressive increase throughout the experiment and there was significance (p<0.05) difference throughout the experiment.
No significance difference (p > 0.05) observed in weight gain for week 6 and 7 and significance difference was observed throughout the remaining weeks. Also, there was no significance difference (p > 0.05) observed between specific growth rates of the dietary protein level in week five and seven and there was significance in the rest of the week. The weekly specific growth rate decreases throughout the duration of the experiment (Figure 2).
No significance difference occurred (p > 0.05) in week 3, 6, 7 and 8 and significance difference was observed in week 1, 2, 4 and 5 (Figure 3). The food conversion ratio increases throughout the experiment. It was reveal that Gross Conversion Efficiency decreases throughout the duration of the experiment and significance difference (p < 0.05) was observed from week seven to week 8 whereas no significance difference observed from week 1 to week 6 (Figure 3).
There was significance difference (p < 0.05) throughout the experiment and the protein intake increases throughout the experiment. Significance difference (p < 0.05) was observed in the protein efficiency ratio expect for week four where there is no significance difference in the fry fed with the four experimental diet (Figure 4). No significant differences (p > 0.05) in specific growth rate, food intake, food conversion ratio, gross food conversion efficiency and protein efficiency ratio while significant difference (p < 0.05) in the weight gain, protein intake (Table 2).
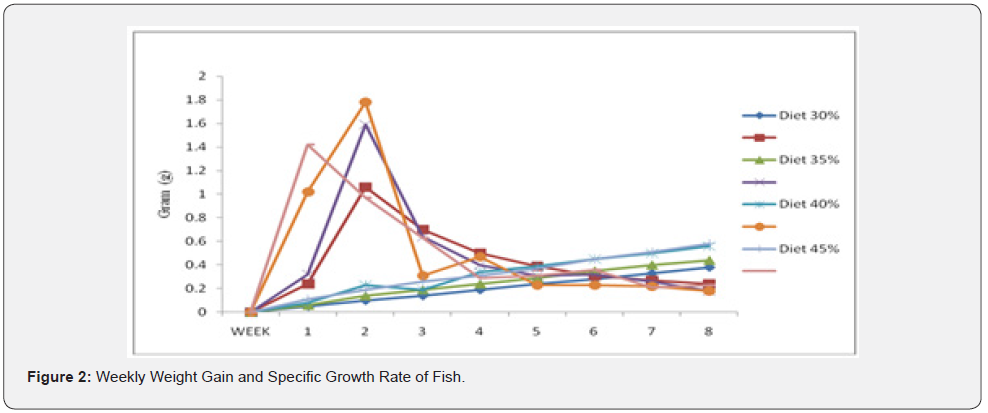
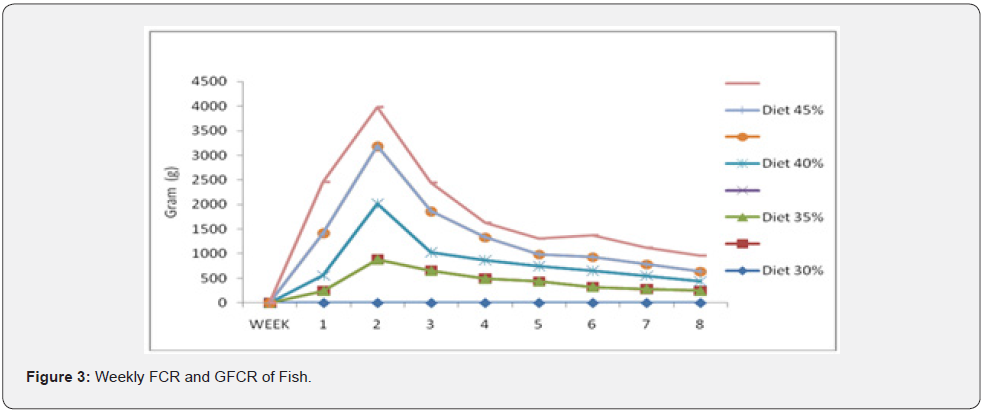
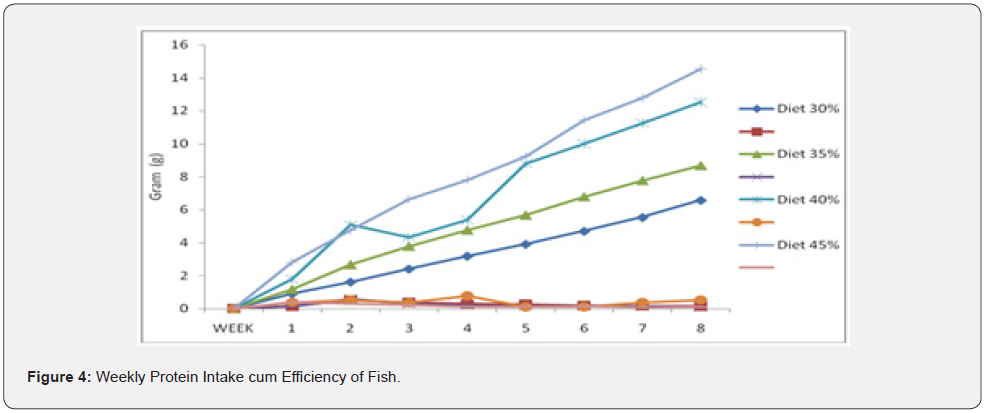

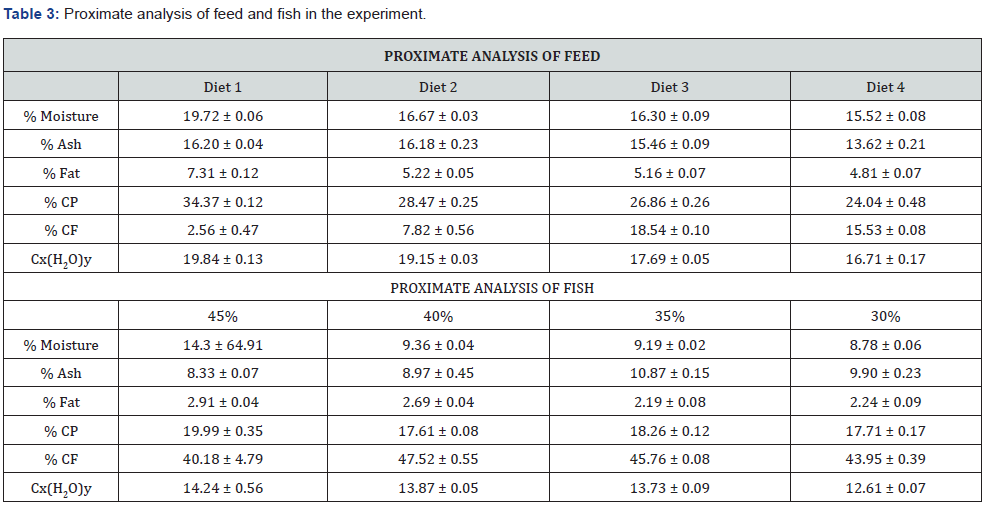
Table 3 shows proximate analysis of feed Percentage crude protein had the highest mean value in each Diet 34.37 ± 0.12, 28.47 ± 0.25, 26.86 ± 0.26, 24.04 ± 0.48, the lowest value was observed in Fat content for Diet 1, Diet 2, Diet 3 and Diet 4 had 7.31± 0.12, 5.22± 0.05, 5.16 ± 0.05 and 4.81 ± 0.07 respectively. The proximate analysis of fish sample in each Diet; the percentage crude fiber had the highest mean value of 40.18 ± 4.79, 47.52±0.55, 45.76±0.08, and 43.95±0.39 and fat content has the lowest Diet of 2.91 ± 0.04, 2.69 ± 0.04, 2.19 ± 0.08 and 2.24 ± 0.09 (Table 3). The experimental earthen pond water temperature, pH, dissolved oxygen and total alkalinity ranged from 27-28.5°C, 6.8-7.5, 5.8- 6.4ppm and 120-128ppm, respectively during the entire rearing period.
Discussion
The highest cumulative weight gain was recorded in fry fed on Diet 1(45%) with 10.58 ± 0.12 while the lowest was observed in fry fed with diet 4(30%) with 6.58 ± 0.21, similar findings have been reported by different authors for different tilapia species that the dietary protein requirements of several species of tilapia have been estimated to range from 20% to 56% [33,34,40-42]. The specific growth rate decreased throughout the duration of the experiment. The highest food conversion ratio was observed in the fry feeds with Diet 2 crude protein with the value of 0.32 ± 0.57 cumulative. The other feeds 30%, 35% and 45% crude protein recorded 0.25 ± 0.04, 0.32 ± 0.57 and 0.25 ± 0.04 respectively which were similar to [43]. The highest cumulative gross food conversion efficiency was recorded in the fry fed with 532.14 ± 131.12 and the lowest gross food conversion efficiency was recorded in fry fed with 35% crude protein with the value of 412.48 ±105.57 corresponding to the observations of [41,42]. The fry fed on Diet 2 crude protein recorded the highest protein efficiency ratio and fry fed with Diet 1 crude protein diet recorded the lowest protein efficiency ratio. PER, in the present study, was significantly affected by protein levels and manifests that protein utilization was obtained at low protein level. The decrease of PER with increasing dietary protein level have also been reported by different authors for different tilapia species [44,45]. This was mainly because more dietary protein is used as energy when high protein Diets are fed to fish [30,40]. The highest cumulative protein intake was recorded in the fry fed on on Diet1, having a value of 8.75 ± 1.43, this was followed by Diet 2 with the value of 7.40 ± 1.34. Frys fed with diet 3 with the value of 5.17 ± 0.91 and this was observed to the lowest experimental Diet which was fry fed with Diet 4 which recorded 3.74 ± 0.71. The proximate analyses of sample feed fed fry of Wesafu showed that the percentage crude protein was highest in the feed with 45% having a value of 34.37 ± 0.12 and the lowest was observed in feed with 30% with value of 24.04 ± 0.48. The formulated experimental feed with 40% recorded 28.47± 0.25 while 35% recorded 26.86 ± 0.26. Fry on proximate analysis recorded better productive protein values in the 45% feed with the value of 19.99 ± 0.35, 35% feed with value of 18.26 ± 0.12 followed by 40% feed with 17.61 ± 0.08 and 30% with 17.71 ± 0.17.
Conclusion
This study clearly indicated that diet containing 45% crude protein bodes well for cichlid aquaculture industry and appear to be suitable for rearing Wesafu fry to fingerlings in earthen pond with the potential to be a successful feed and alternative replacement for coppens in tilapine feed formulation.
To Know More About Oceanography & Fisheries Open Access Journal Please click on:
https://juniperpublishers.com/ofoaj/index.php
For more Open Access Journals in Juniper Publishers please click on:
https://juniperpublishers.com/index.php

Comments
Post a Comment