Spatial Variation of Demersal Fish Communities in the Platform and Channel of Yucatan- Juniper Publishers
Juniper Publishers- Journal of Oceanography
Abstract
The nature semi-closed of the Gulf of Mexico, together with its oceanographic pattern and freshwater discharges, provide a rich region considering biodiversity. However, the demersal fish community structure is almost not known, even that this great ecosystem has been continuously impacted by oils spills and over exploitations of fishery resources. The present study was developed to evaluate spatial variation of the demersal fish community and with depth gradientin area of the Platform and Channel of Yucatan, southern Gulf of Mexico. Sampling was realized in 18 stations with an oceanographic ship using a shrimp trawl at 99m as average depth. A total of 129 species were recorded, where Serranidae family was the most diverse (10 species), following in importance Paralichthyidae (eight species), Sparidae and Triglidae with seven species each. The most representative specie considering density was Syacium papillosum (12.4% from total). The highest density and biomass were recorded in the Channel of Yucatan due to the abundance of Sphoeroides spengleri and Syacium papillosum. Considering fish composition and abundance, three groups of stations were associated. Relationship of the fish abundance with depth was not significant. However, at the superior stratum (<50m), the highest species richness (103) was obtained, while at 100m the diversity (3.35 bits) was recorded. By contrast, at the highest depth (>200m), the lowest species richness (41) and diversity (2.9 bits) were found. These results are the first ones conducted in the region, contributing to the functional ecology of the Gulf of Mexico, that will provide the guidelines for proper management to stop further biodiversity decline in this large ecosystem. This information is also a line base to evaluate the level of impacts by oil spills and other stressors related with climate change.
Introduction
The Gulf of Mexico (GM) is recognized as an important center of marine and estuarine biodiversity, with the presence of cosmopolitan and endemic species [1]. Its high productivity manifests itself in terms of its fishing resources, most of them of great fishery importance,and in economic terms, this great area represents an important source for the exploitation of fossil fuels. It is characterized by its dynamic nature due to the influence of natural hazards (hurricanes, tidal storms, tsunamis and floods), which have increased in frequency and magnitude with climate change. These characteristics, combined with the extraction of hydrocarbons, lead to additional pressure on coastal ecosystems and recurrent spills of pollutants, resulting in large-scale ecological, social and economic impacts [2]. The entire process of exploration, exploitation and transport of hydrocarbons has led to degradation in the quality of the coastal environments, widely recognized for their value as a breeding and rearing area for fish and other resources [3]. There is an increase in the loss of critical habitats (wetlands, mangroves), degradation of the marine and estuarine-lagoon environment, decline in fish occurrences and abundances with other organisms, decreases in diversity, and increased vulnerability to natural hazards [4,5].
To characterize and predict the environmental impact of a large-scale spill, it is necessary to know and understand the functioning of the great GM ecosystem, including Yucatan Channel (YCh), to evaluate the environmental and biotic changes, to determine the type of response at the ecosystem level considering these disturbances. In addition, it is necessary to establish the baseline conditions as well as to to distinguish changes caused by oil spill from natural variability of coastal and oceanic ecosystems.
In this sense, in this study it is intended to know the baseline structure of the epifauna (fish), to determine the composition, distribution and ecological parameters of the fish component, as well as the assemblages of the species in function of the main environmental variables at spatial and bathymetric levels. It is important to mention that to determinate the structure of biotic communities and monitoring the ecosystemic valuation of GM is of vital importance in developing contingency plans in case of significant alterations in the environment.
Study Area
The GM is a deep marginal sea located at the southeastern corner of south America, considered as an important center of marine and estuarine biodiversity, with the presence of cosmopolitan and endemic species. It is the ninth largest body of water in the world with a surface area of 1.51x10⁶km2 and a volume of 2.43x10⁶km3, representing 0.4% and 0.2% of the surface area and volume of the world's oceans,respectively [1].
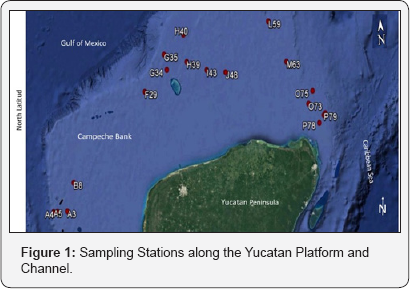
The Gulf is connected to the Caribbean Sea through the Yucatan channel and to the North Atlantic Ocean though the Straits of Florida. The basin is surrounded by three continental shelves: Florida, to the East; Texas-Louisiana, to the Northwest; and Campeche and Yucatan, to the South (Figure 1).
The continental shelf of the northern Yucatan Peninsula, also known as Campeche Bank, is characterized by a circulation with consistent directionality to the W dominated by the action of the trade winds [6] and the Yucatan Current [7].
Methodology
The campaign was carried out in two periods from November 17 to 18, 2015 and continued from April 13 to 16, 2016 due to the weather conditions that made it difficult to conclude the campaign in November of that year. Sampling comprised the northern part of the Yucatan Platfom (YP) and the YCh, which is greatly influenced by Caribbean waters. Fish collection was realized using a shrimp net (18.3m, 3.4cm mesh size), operated by a boat of 21.7m in length (Figure 1). Prior to the completion of each trawl, the substrate was monitored with an echo sounder so as not to cause any ecological deterioration. At the end of the trawl, fish specimens were separated from the macroinvertebrates and were preserved in freezing with the collection data (station number and date). Basic data (collector, method, preservation, date, time, station number, depth, stratum, etc.) were included in the records designed for this process for identification and tracking. In addition, photographs were taken of specimens whose fresh coloration is considered essential for taxonomic precision, and for specimens whose size makes it difficult to preserve (>1.0m). In both cases, the biometric records of the specimens were taken.
In the laboratory, the specimens were identified using specialized literature [8-10]. The systematic order was based on the criteria of Greenwood et al. [11] modified by Nelson (2016). A representative sample by species was deposited in the Ichthyological Collection of CINVESTAV-IPN, Unidad Merida (key: YUC.PEC.084.0999) as reference material. The weight and standard length (LE) of all specimens collected from each species were recorded and the density and biomass databases were developed by unit area (ind/m2;g/m2), average and total values by species and station were extrapolated to 1000m2. Information is included on the number of individuals recorded by species, size range (LE).
Data analysis
The estimates of the ecological parameters of each collection site (equity, richness and diversity of species) were obtained with the objective of comparisons between sampling stations.
The ecological parameters of the fish community, such as species richness (S), Pielou's evenness index (J) and Shannon- Wiener Index (H') were analyzed spatially and by depth. This index, based on information theory, estimates the uncertainty in predicting which species belongs to a randomly selected individual from a collection of S species and N individuals, whose value increases with the number of species and high equity [12,13]. Pielou index (J) considers the relation between the observed and maximum possible diversity of each season [14]. The values of «J» may have a range from practically zero (non-equity) to one (completely equal).
Dominant species were determined at each sampling site through the Importance Value Index (IVI), which considers relative density
a) Biomass
b) Frequency of occurrence
c) Of each species [15].
The species that together constituted at least 75% were considered as dominant.
IVI = 0.33 (a+b+c)
Sampling stations were categorized considering the structure of the demersal community with the species with abundances greater than one. A non-metric multidimensional scaling (MDS) with 1000 interactions, derived from a Bray- <Curtis similarity matrix constructed from the fish density data was contrasted by spatial variations (East, North, West) and depth gradient (<50, 100 and 200m). The effect of the extreme values was minimized by transforming the density of the species by their fourth root.Differences among groups were analyzed by ANOSIM, procedure that consists of a statistical test (R), which is analogous to an ANOVA. The null hypothesis tested was that no differences existed between the fish assemblages at the three ranges of depth and at the three spatial areas.Species habitat and depth was evaluated with a SIMPER analysis, which determines thepercentage contribution of each species to classify a group (similarity) [16].
In addition, a multidimensional metric scaling (MDS) analysis was performed, which is a procedure based on the distances that order the study units based on the range of species rank dissimilarities [17]. Multivariate analysiswas performed using the statistical package PRIMER V7.
Results
Fish collections were realized in 18 sampling sites located in the YP and YCh at an average depth of 98m with an average duration and velocity of 15min and 2.5 knots respectively (Figure 1).

During the campaign, 3221 fish were collected, contributing with a total weight of 247.5kg and an average density and biomass of 21.1±17.3ind/1000m2 and 1678.1±1206.1g/1000m2.
A total of 129 species (25 orders, 47 families) were recorded. Within the group of Chondrichthyes, four species were recorded in three families and three genera, while within Osteichthyes, 25 orders were determined, where the Perciformes included the largest number of families (9). The family Serranidae was the most diverse (10 species), including species of the genus Diplectrum, Serranus, Hyporthodus, Centroprostis, and Rypticus (Table 1). It is followed in representation by the number of species the families, Sparidae and Triglidae with seven species each. A total of 14 families were represented by one genus and one species.

Among the species of commercial importance in the region were the branches, or palometas (Carangidae), snapper (Lutjanidae), mojarras (Sparidae), barracudas (Sphyraenidae) and sole (Paralichthyidae).

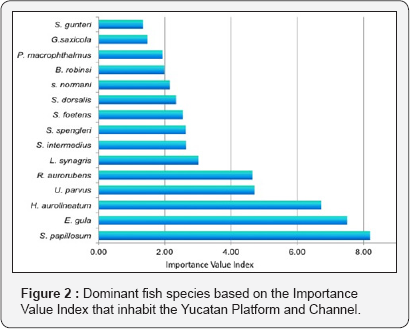
Considering the IVI, 15 species were dominant, which presented a value>1.3, and contributed with more than 68% of their density (Figure 2). The most representative species for its biomass and occurrence was Syacium papillosum (B: 9.9%, FO: 3.9%). Eucinostomusgula was the most representative because of its density (15.3%). The other 13 species contribute 22.9% of the total density and 51.4% of the biomass.
The highest specific richness was recorded in B8 and M63 stations; in both were recorded 39 species (30.2%). Followed by species number the station J48 documented 34 species (26.3%) and the lowest species number was obtained in the station G35 located north Alacranes reef, with 7 species (5.4%). .
The highest species richness (39) was recorded at station B8, while the lowest values of this parameter were at G35 and H40, with 8 and 7 species, respectively. Regarding species diversity, values between 1.5 and 3.1 were presented, with the maximum value obtained at station M63. The lowest values of diversity were recorded in the northern Alacranes reef area (G35)
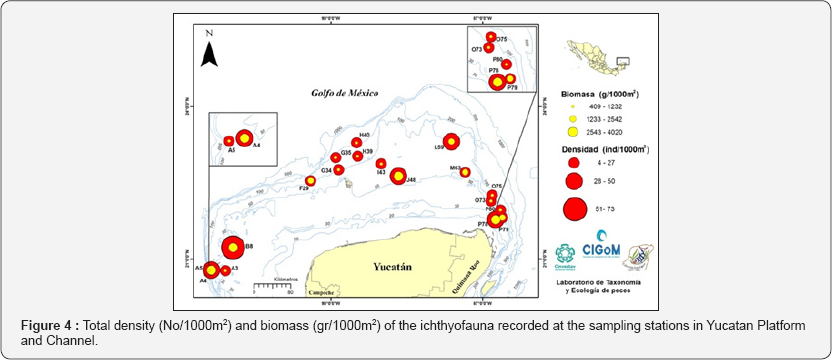
The highest total density was recorded in B8 station with 72.9ind/1000m2, which is represented by a high numerical abundance of Eucinostomus gula (42.0 No/1000m2). The highest biomass was obtained in station A4 (4.0kg/1000m2) by the contribution by weight of Lutjanus synagris with 1171.03g/1000m2. Both stations are located in the eastern zone of the Yucatan Platform (Figure 4).


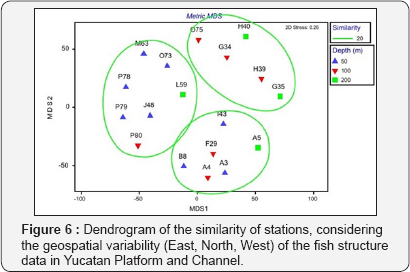
Cluster analysis represents three group of stations considering spatial variability (west, north, east), with significant differences among them considering ANOSIM test (R: 0.752, p<0.001) (Figure 5). In contrast, the variability of fish structure did not show significant differences between the depth gradients(<50, 100 and 200m) (R: 0.09, p> 0.1) (Figure 6).


Discussion
The registration of 129 species (47 families) obtained during this first campaign, is considered significant in terms of biodiversity. However, a review of the recorded species is still lacking, to determine the first records for the Yucatan Channel and Platform region. We are sure that the species richness and diversity will increase with other campaign that probable will be realized soon. Previous studies conducted in the Gulf of Tehuantepec indicate a record of 178 species as result of five campaigns [18]. Subsequently, for the continental shelf of New Zealand with demersal ichthyofauna sampling at five depth ranges and with a maximum of400m and 118 stations, a record of 100 fish species (55 families) was recorded in two annual series (total eight campaigns) [19]. In this respect, it should be noted that these are the first results of the demersal ichthyofaunal in in the study area; hence its value in terms of its contribution to the functional ecology of the large Gulf of Mexico ecosystem.
Regarding depth, it has been mentioned in previous studies that it is the variable with the greatest influence on the composition of demersal fish assemblages and with secondary effects the latitude, sediment and temperature of the bottom [19]. Among the results obtained in relation to the response pattern of the demersal ichthyofauna to three depth ranges, we found that this is not significant and with little variation through the cluster and MDS analyzes by stations and bathymetry. In both analyzes are formed three groupings of the stations sampled by the specific composition and the density. However, in the upper stratum (<50m), the highest species richness was recorded (103) and in the 100 m stratum, the highest diversity was estimated, diversity (3.35bits), the differences between the two groups were not significant. On the contrary, at 200m, a lower species richness (41) and diversity (2.9 bits) were obtained, which can be due to oxygen depletion conditions or other factors that will later be determined in the sedimentary environment, and to establish the possible relationships with environmental variables, including pollutants as well as their level of influence.
To Know More About Journal of Oceanography Please Click on: https://juniperpublishers.com/ofoaj/index.php
Comments
Post a Comment