On the Correlation of Sea Surface Temperature and Chlorophyll in Upwelling Events from Satellite Imagery- Juniper Publishers
Juniper Publishers- Journal of Oceanography
Abstract
The relationship between SST and chlorophyll fields from satellite imagery can be computed from several methods. However, the value of the correlation of both fields uses to be lower than expected. It is demonstrated that this is due to a shift between the two fields from the time response of the biological system and the marine dynamic. Authors present a simple method to correct the shift between both fields based on the computation of their skeletons to improve the correlation.
Keywords: Upwelling; Sea Surface Temperature; chlorophyll; satellite imagery; correlation
Abbreviations: SST: Sea Surface Temperature; ITCZ: Intertropical Convergence Zone; OOD Observatorio Oceanografico Digital De Venezuela; MODIS-SCAR: Moderate Resolution Imaging Spectroradiometer Southern Caribbean
Short Communication
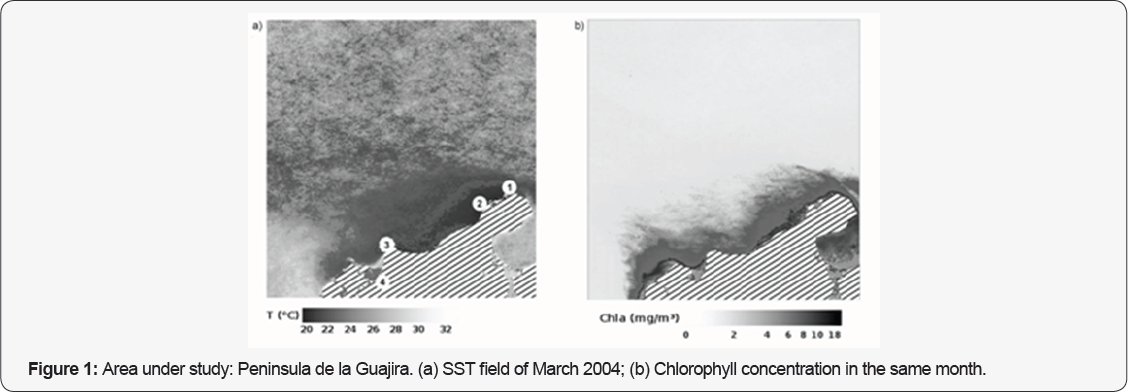
The oceanographic conditions of the Colombian Caribbean coast (Figure 1) are highly influenced by the quite persistent Eastern trade winds in the area [1,2]. Wind direction is mainly aligned with the coast and continental shelf inducing an Ekman's transport towards the open ocean and a coastal upwelling [2].The upwelling uses to happen in the Peninsula de la Guajira (Figure 1). The regional oceanography is characterized by the seasonality of the upwelling events [2], determining the spatial distribution and the variability of the phytoplankton [3-8] and commercial fisheries in the area [9,10].

The upwelling events are highly spreading, so eddies with biomass input in the oligotrophic Caribbean [6,13]. However, high plankton content can be found towards the open sea due maximum plankton concentration does not always happen to the wind drift [11,12]. This is relevant for the nutrient and when the upwelling is running or trade winds are persistently blowing [13]. There are different ways to study the relationship between the sea surface temperature (SST) and chlorophyll from artificial satellite imagery. The correlation pixel by pixel was used in [14-16], the use of the Hovmoller diagrams can be found in [17] and in [18], finally the empirical orthogonal function analysis between time series of SST and chlorophyll was in [19]. Each technique has collateral and interesting results as it can be seen in the above references. However some difficulties can arise because the biological system, with the chlorophyll as physical observable, takes some time to react to the colder and richer in nutrients water. The use of empirical orthogonal function decomposition implies the choice by the user of several points to extract time series of SST and chlorophyll. The same happens with the use of the Hovmollers diagrams and the results will depend on transects. Finally, the direct correlation between images leads to lower correlation values than expected.
Now, the authors propose a simple approach to reduce the bias of the correlation between the images of SST and chlorophyll based in [20,21]. The organization of the work is as follows: the area of study and a brief of techniques of analysis are presented in Section 2. Section 3 is devoted to the results and their discussion. Finally, conclusions are drawn in Section 4.
Area of Study, Imagery and Computational
Area of study
The Caribbean Sea is an oligotrophic water body with influences from the discharges of rivers Magdalena, Orinoco and Amazonas [22]. Along the Colombian Caribbean coast, the Peninsula de la Guajira is the northern point of South America. The Cabo de la Aguja is located southeast of Punta de la Guajira (Figure 1). The upwelling events take place there when the eastern trade winds blow persistently in nine detected foci along the Venezuelan and Colombian Caribbean coasts. The climate, marine weather and oceanographic phenomena in the Caribbean Sea depend on the trade winds as a consequence of the latitude of the Intertropical Convergence Zone (ITCZ) [20,21,23,24]).
Data description
Two different MODIS-SCAR (Moderate Resolution Imaging Spectro radiometer Southern Caribbean) imagery sets have been considered. They consist of monthly composite images of SST and chlorophyll. Both have been taken from the Observatorio Oceanografico digital de Venezuela (OOD) (http://ood.cbm.usb. ve). The coordinates of the Northeast and Southwest corners are (16 °N, 82.7 °W), (7.8 °N, 52.3 °W) for the area where the upwelling events affect the Colombian Caribbean. Imagery spans from January 2004 to March 2016 with spatial resolution of 1km2. The monthly composite images of SST and chlorophyll for March 2004 are shown as example in Figure 1a & 1b respectively. The surface signatures of SST and chlorophyll look quite similar and they present an inverse relationship, higher temperature lower chlorophyll [25].
Digital image processing
Following Alonso et al. [20] and Blazquez et al. [21], the SST and chlorophyll images have been processed in the same way. The downloaded imagery was converted to 8 bits gray scale images. A detailed statistical study was made to choose a threshold level for each kind of observable. This is hardly needed in order to fix the limits of what is considered o not upwelling. A mask was applied on all images to isolate the area affected by the upwelling. Such areas were then estimated by counting the unmasked pixels.
Skeleton: Skeletonization in a binary image is a process for reducing foreground regions to a one pixel width geometrical structure that largely preserves the extent and connectivity of the original region. It is also called known as Medial Axis Transform. Although it can be expressed in several ways, Lantuejoul (1977) obtained a nowadays widely used formula with basic morphological operators as it is very well detailed in Serra (1982). Because the computation of the skeleton is very sensitive to small details, authors have followed the methodology in Alonso et al. [20] & Blazquez et al. [21], a detailed analysis of the images leaded to the computation of the skeleton of all images preserving the variance of the original grey level images.
Result

It has been pointed out some different methodologies to study the relationship between SST and chlorophyll. The spatial correlation of each pair of images of SST and chlorophyll for all months is presented in Figure 2. Authors have been careful in not to include the pixels corresponding to the land in order to avoid additional bias. As it is observed, a negative correlation must be expected because lower temperature higher chlorophyll concentration. There are few positive values of correlation and very small. Only few times, really relevant correlations were got as at the beginning of 2007 (about -0.7) and March 2010 (about -0.6). But higher values must be expected along the time series. The correlation between the SST and chlorophyll of March 2004 (Figure 1) is about -0.4 but visually it may be much higher.

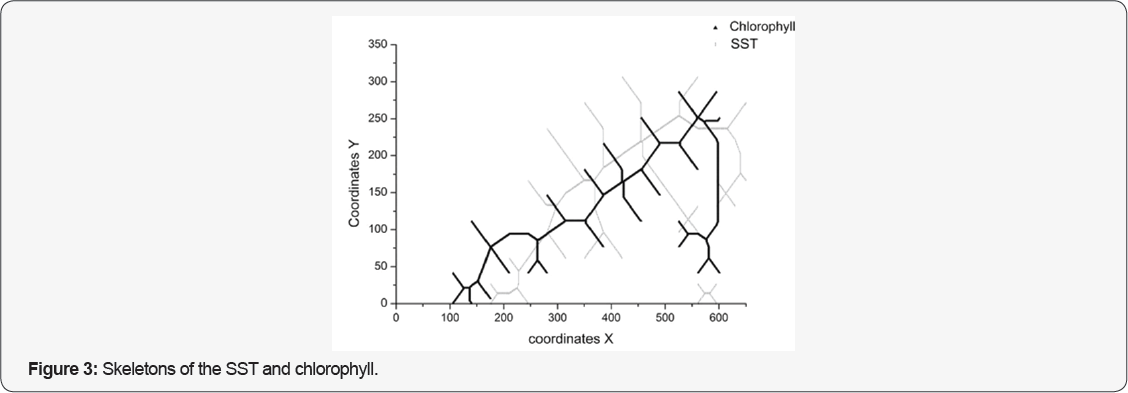
This can be easily explained by computing the skeleton of the SST and chlorophyll fields. From the joint plot of both skeletons Figure 3, it is easy to see that they look similar but they do not coincide. They are shifted but the shift is not the same in all points because the marine current field is acting, with a different drift in each point. Hence, when computing the spatial correlation a lower value than expected is obtained.
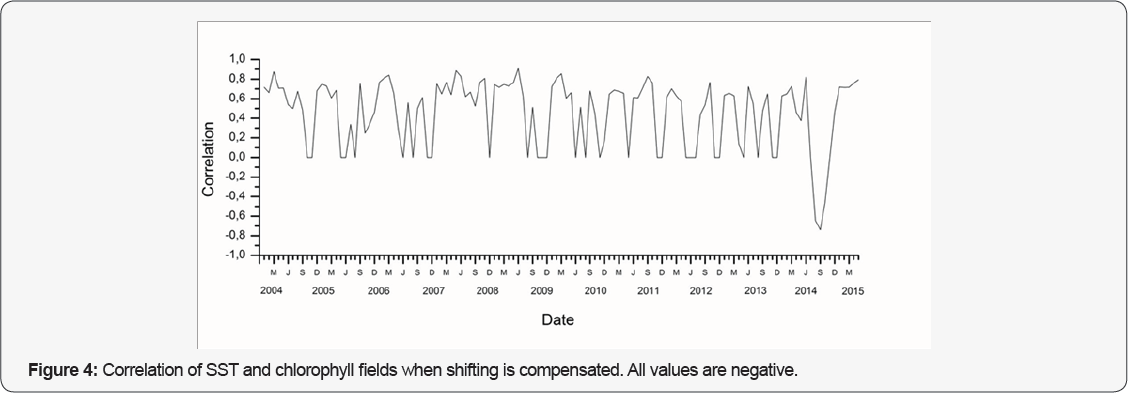
The effect of the shift on the correlation has been solved as follows. The coordinates of the skeletons were isolated from West to East and two new arrays with the values of SST and chlorophyll in such points were created. The number of points must be similar but they can be different. In this case, the cross-correlation function between both spatial series must be understood as a spatial cross-correlation. Its maximum will correspond to the correlation of both data sets when the shift is compensated. The unbiased by shift compensation correlations are presented in Figure 4. Now the correlation for March 2004 (Figure 1) is about -0.87. The comparison of Figure 2 & 4 shows an improvement of the correlations. Those places with zero correlation means that there is no upwelling acting and no skeleton could be computed [26].

Conclusion
The relationship between SST and chlorophyll fields from satellite imagery can be computed from several methods. However, both fields are shifted because of the time response of the biological system to the marine dynamic and wind drift. The computation of the skeletons of both fields leads to some shift between them. Hence, the direct correlation between both images leads to lower values than expected. Authors have developed a simple method to correct the shift between the skeletons of both fields. The values of both observables at the locations of the skeletons form two spatial series of values and their cross-correlation helps to determine the shift and the correlation. Finally, although this method is quite general, every area of the ocean has its own characteristics and physical configuration, needing to be adapted.
To Know More About Journal of Oceanography Please Click on: https://juniperpublishers.com/ofoaj/index.php
Comments
Post a Comment